Survey Accuracy and Insightfulness Considerations
Six factors to ensure statistical accuracy and insightful survey results are:
- Survey design
- Survey quota
- Population
- Sample size
- Margin of error
- Survey invitations

1. Post-Contact Survey Design 5 Steps:
Step 1. Define survey objectives
- Define a clear, attainable goal for your survey
- Determine the use of survey results
- Determine target group(s) for accountability
Step 2. Develop post-contact survey introduction and questions
- In the introduction of the survey, use a warm, inviting, and clear reason to participate
- Get feedback from employees of a target group to identify key issues
- Translate those into questions and answer categories
- Use SQM's post-call standardized survey questions to accurately benchmark performance
- Another option is to develop simple and clear survey questions
- Start the survey with KPIs questions (e.g., Overall Csat, NPS & FCR)
- Use qualitative (e.g., open-ended) and quantitative (e.g., closed-ended) questions
- Keep the transaction survey short (5 minutes or less) to maximize response rate
- Don't ask leading and double-barrel questions
- Keep the more personal questions to the end
- Do a test pilot on the survey, check for validity, and improve if necessary
Step 3. Select respondents and the survey data collection method
- Choose a survey quota either by agent, call center and LoB or other quotas
- Ensure that the survey quota (e.g., sample size) provides valid conclusions
- Choose the survey method: phone survey, email surveys, IVR surveys, etc
- Maximize response rate through appropriate survey method and design
- Determine how you will follow up with customers who are dissatisfied with your service
Step 4. Roll out the tested survey
- Ensure acceptable response rate (3% to 10%) to achieve valid customer survey results
- Use professional survey vendor or train interviewers on conducting proper surveys
- Communicate to all stakeholders customer survey objectives
Step 5. Analyze survey results
- Collect VoC Surveys: Conduct a one-time snapshot study for CX benchmarking insights and track CX ongoing to determine trends
- Focus on KPI Metrics: FCR, the king of all metrics, measures the agent's ability to resolve the customer's inquiry on the first contact
- Analyze KPI Metrics by Segments: Comparing KPI's by call reasons, LoBs, and locations to provide CX insights trends and CX improvement opportunities
- Assess Call Handling Metrics: Call handling metrics such as hold, transfer, and agent helpfulness are essential indicators of providing great service
- Investigate Repeat Call Reasons: Using a VoC Closed-Loop process like IDCA (Identify, Develop, Check, Act) to understand the reasons inquiries are not resolved in one contact is crucial to improving FCR and Csat
- Understand the Business Impact: Metrics like Net Promoter Score®, Csat and CX Greatness tell you the contact center's CX performance impact on the organizational customer relationships
- Recognize the Role of Each Channel: Multiple channel metrics provide an awareness of your customer's habits when contacting your organization through the website, call center, or other channels
- Action Your Data: Knowing the pain points in your contact center is the first step. The next is to plan and take action to improve your FCR by addressing poor performance and reasons for repeat calls
Other Survey Accuracy and Insightfulness Considerations
2. Survey Quota
One of the most important aspects of improving customer service is determining the survey quota. Call centers that show the most significant improvement use quotas at the agent level and create accountability for Voice of the Customer (VoC) call resolution at the agent level and First Call Resolution (FCR) at the management level. In addition, the customer satisfaction (Csat) metric is used for employee accountability (e.g., agent to SVP level).
The typical sample size for an agent-level quota is five surveys per agent per month. However, SQM considers it a best practice to conduct 10 surveys per agent per month. The primary complaint that SQM hears from agents is that a sample size of five surveys per month is too small to reflect their performance accurately. A similar complaint that managers hear about is that only five QA evaluations per agent per month are insufficient. A sample size of 10 surveys per agent per month will add up to 120 surveys for the year, providing a margin of error of ± 9%.
Another best practice regarding sample size is using a three-month rolling average to report FCR, Csat, and call resolution performance. For example, if 10 surveys per month are conducted at the agent level, after three months of surveying, there would be a sample size of 30. Every new month replaces the oldest of the three months in the three-month rolling average for reporting FCR, Csat, and call resolution performance. The three-month rolling average for reporting FCR, Csat, and call resolution performance can be used at the agent, supervisor, or call center levels. The rolling average provides a bigger sample size and confidence in CX ratings.
3. Population
The population is the number of people you are trying to study. A population is finite if there are a countable number of people in the population. Conversely, if the people in a group are not countable, it is an infinite population. An infinite population can be assumed for populations larger than 20,000. The finite population calculator should be used for populations less than 20,000, such as employee studies.
4. Sample Sizes
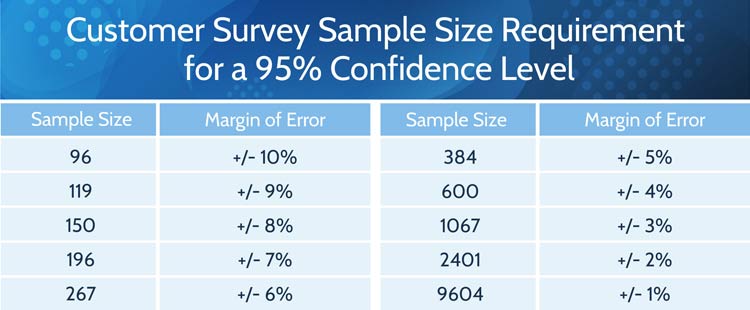
Figure 1 shows customer survey sample sizes with the corresponding margin of error percentages, based on an infinite population and confidence level of 95%. The confidence level describes the reliability of the survey results. For example, a 95% confidence level means that if the same survey study is conducted numerous times with random samples of the same population, 95% of the intervals will contain the true population mean. In other words, if a study is conducted 20 times, 19 of the studies will capture the true population mean within the interval given by the margin of error.
Figure 1: Survey sample size requirements for a 95% confidence level for a large population
5. Margin of Error
The bottom line is that the larger your customer sample size is, the lower the margin of error and accuracy of survey FCR and Csat ratings. However, most SQM contact center clients use a margin of error of ± 5% for a customer experience (CX) benchmarking study and a margin of error of ± 3% for an ongoing quarterly CX tracking study.
6. Survey Invitations
The required number of survey invitations is determined based on what percent of those asked will participate in the post-contact customer survey. The typical post-contact customer survey response rate is 3% to 10%. The employee survey response rate is 50% to 95%. The customer response rate (e.g., agreement to be surveyed) will vary by survey method, contact list quality, customer and employee type, etc.
Contact List Segmentation Considerations
Before post-contact customer surveying begins, there needs to be a good understanding of the contact list information available to dial or email out to customers to achieve statistically accurate and insightful survey data. The more information provided about the customer's contact, the more insightful the analysis will be in improving a contact center's people, processes, and technology practices to improve FCR, Csat, and call resolution performance. The benefit of having comprehensive contact list information is that it can be segmented to analyze the data to help identify what areas need to be fixed to improve CX. Put simply, the more you can segment, segment, and segment the contact list data, the better the CX analysis will be. Listed below are the main types of segmentation information that should be included in the customer contact list that is used for conducting post-contact surveys:
- Main call types/sub call types
- Line of Business and location
- Product and service life cycle
- Value of customer
- Customer demographic
- Timing
- Frequency
- Call center/supervisor/agent
- AHT/speed of answer
- Time/Date
- Transfers
- Holds
- Agent Tenure
- Agent Skill Set
- Calls Pended (Open/Closed)

Reporting FCR, Csat, and call resolution performance by main call types and sub-call types can help determine specific areas for customer service improvement. When identifying which call types need improvement, it is best to focus on main call types and sub call types for unresolved calls. An example of this would be 'billing,' which is the main call type, with the corresponding sub-call types being 'incorrect bill,' 'late payment,' 'bill not clear,' or 'late bill.' Call types can be measured by internal sources and the post-contact survey questions.
Moreover, it is helpful to have the customer provide the main call type and sub-call type data when surveyed. The differences between how a customer and the organization identify the main call type and a sub-call type can be significant. The main reason for this is that the organization better understands the business and can properly identify the main call types and sub-call types from an organizational perspective. However, the customer will identify main call types and sub-call types based on their experiences using the organization's products and services.

The call center's customer contact lists should also include Line of Business (LoB) identification (e.g., individual, commercial, industrial) and the location of the call center. Over the years, SQM has seen many call centers with considerable differences in performance by LoB and location. Therefore, it is helpful to identify opportunities for improvement by the line of business and location.

Including the product or service life cycle information in the contact list is helpful to identify the stage a customer is at for a specific time. The life cycle has four stages - introduction, growth, maturity, and decline. Additionally, it is helpful to understand FCR, Csat, NPS, and call resolution by life cycle to identify CX trends and improvement opportunities.

Many organizations want to provide better service to their high-value customers or understand how the call center's different customer levels (e.g., high, average, and low value) are being served. To understand the service performance of the various customer value levels, the organization needs to include customer value level identification on the customer contact list.

Customer demographic information can include age range, geography, education, gender, income, or occupation and can be helpful on customer contact lists. For example, SQM finds age to be insightful because FCR performance tends to be higher for customers who are older than 50 years of age. You can quickly and effectively collect demographic information with survey questions or by internal sources.

It is SQM's experience that timing is also essential when conducting post-contact customer surveys. Surveying customers within one hour using the IVR or email survey method or within one business day using the phone survey method is considered a best practice. The key is to survey customers within one business day so that they can remember their call center experience. Customer survey data accuracy and quality of feedback after one business day are significantly lower than when conducted within one business day.

How frequently should a customer be surveyed? At most, a customer should be surveyed no more than two times a year. If a customer cannot complete a post-contact survey, they should be contacted back no more than two times by phone, email, or automated IVR survey. If customers refuse to complete the survey, they should be put on the do not contact list. When customers are dissatisfied, it is best to have someone from the organization contact them to recover from the perceived poor customer service. It is essential to re-survey the customer within two business days of the recovery attempt to follow up on whether or not the customer is still dissatisfied.

To create FCR, Csat, and call resolution metrics accountability, some of the most critical areas of information to be included and identified on the customer contact list are which call center, supervisor, and agent handled the call. The most significant and quickest FCR gains come from creating agent and management accountability for FCR and call resolution performance.

Average handle time (AHT) data correlated to FCR results can determine whether or not the call length had a negative or positive impact on CX. Also, including speed of answer information on the customer contact list can help determine whether or not the speed of answer had a positive or negative effect on Csat results. For example, SQM's research shows that there is no negative impact on Csat if the call is answered within 120 seconds.

Including the time and date of the call on the contact list can provide meaningful information on how the call center is performing. For example, SQM has found that call centers can have 1% to 5% lower Csat performance during evenings, on Mondays, and weekend shifts versus regular business hours.

The customer contact list should also identify whether or not the call was transferred to another agent. SQM's research shows that Csat drops by as much as 15% when a customer is transferred. Therefore, it is crucial to identify the main and sub-call types that are transferred, as lowering the number of transferred calls can significantly improve Csat performance. SQM's research also shows that 19% of customer calls are transferred to another agent. Transferred calls can be measured by internal sources and the post-contact survey questions.

Given that 46% of customers are put on hold, it is beneficial to have the customer list include whether or not customers were put on hold. FCR and Csat can drop significantly when the customers are on hold for too long or too many customers are put on hold. Put on-hold calls can be measured by internal sources and the post-contact survey questions.

Having information on the contact list about agent tenure can be extremely helpful in providing information as to agent performance by the length of their service (e.g., new hire agents, average tenured agents, or long-term tenured agents). For example, SQM research shows that long-term agents have lower call resolution and Csat performance in many cases.

Including information on the contact list about agent skill set (e.g., by call type, skills, knowledge, training, LoB) can help provide insights into specific skill sets that agents have good VoC performance or poor VoC performance.

Given that 9% of calls are pended, it is beneficial to have the customer list include the calls tagged as 'open' or 'closed' to determine the impact of pended ('open') calls on VoC performance. Pended calls can be measured by internal sources and the post-contact survey capturing methods.
Quick Related Links
First Call Resolution Definition First Call Resolution PPT First Call Resolution Benefits
First Call Resolution Strategies First Call Resolution Operating Philosophy FCR Case Study Survey Data Calculate First Call Resolution Top 10 CX Metrics VoC Closed-Loop Outside-In to Inside-Out Journey Mapping Customer Service Sample Size Calculator