Operational Performance Impact on First Call Resolution
In 2021, SQM conducted a call center industry operational benchmarking data research study. The research purpose was to examine the impact of the top 12 operational data and practices has on the First Call Resolution (FCR) rate and improvement opportunities. SQM Group captured operational benchmarking data and practices (e.g., call center stats, human resources, call escalation, quality assurance, and call handling) for over 300 leading North American call centers. Below are some of the highlights from the call center industry operational benchmarking data:
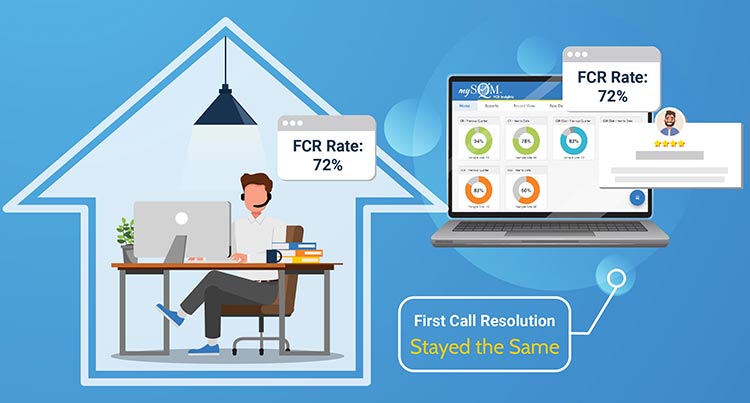
1. An Increase in Work from Home Agents has Not Negatively Impacted FCR
In 2019 (Before Covid), the percentage of Agents working from home was 19%. During the Covid Pandemic (2021), the proportion of work-from-home Agents was over 80%. For the over 500 North American call centers we benchmarked, their FCR rate in 2020 was 72%, and in 2021, it was also 72%. Put differently, even though Agents working from home have significantly increased, it did not negatively impact FCR.
The big insight from this finding is that it does not matter where an Agent is located (i.e., home or call center). What matters more is who the Agent is, training, coaching, technical support, call handling practices, performance management, technology, and recognition.
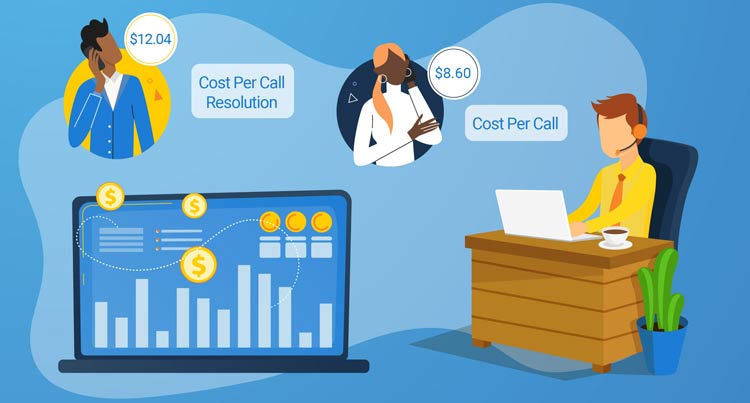
2. Cost Per Call Resolution a More Accurate Cost Metric
The operational data revealed that the cost per call for the average call center was $8.60 and was similar for a world-class First Call Resolution (i.e., 80% FCR rate or higher) call center. Another way to examine cost per call is to include how many calls are used to resolve inquiries or problems (i.e., cost per call average - $8.60 x the average number of calls to resolve – 1.4). The cost per call resolution for the average call centers is $12.04. For world-class FCR call centers, their cost per call resolution is 20% lower than the average call center.
The main reason why cost per call resolution is lower for world-class FCR call centers is fewer customers have to call back to get their inquiry or problem resolved. The cost per call resolution metric factors all calls required to resolve a customer inquiry or problem, which is an accurate indicator of cost for call handling for resolving an inquiry or problem. The cost per call resolution metric can help develop a business case for FCR improvement initiatives.
The cost per call resolution is a more accurate metric than using only the cost per call (CPC) metric. The CPC metric can lead to focusing on lowering AHT and not always using call handling best practices (e.g., warm transfer, summarizing the call, and concierge service). It is SQM’s viewpoint that using call handling best practices can lead to lower cost per call resolution because customers are not having to call back to resolve the same inquiry or problem.
3. The Shift from Average Speed of Answer to FCR Focus
Many call centers use service level and average speed of answer (ASA) as the metric for defining customer service. While these metrics speak to speed, they do little to shed light on call resolution, customer satisfaction (Csat), or the number of calls a customer makes to resolve their inquiry. Although keeping track of these metrics remains important, it is not considered a best practice to focus on service level and ASA metrics as the key indicator of customer service. A best practice is to use First Call Resolution, not service-level metrics, to measure a call center's customer service performance.
Proper execution in shifting from a service-level focus to an FCR focus can be challenging for call centers with an ingrained culture of defining customer service success through service levels and ASA. For call centers to successfully transition from a service-level and ASA focus to an FCR focus, there needs to be a paradigm shift in thinking that FCR, not service levels, is the key to Csat. SQM research shows that ASA has no impact on Csat for the first 120 seconds of a call. In other words, if an Agent answers the call within 120 seconds, there is neither a positive nor a negative impact on Csat. What customers want is to have their call resolved and preferably on the first call. "Every 1% improvement in FCR, there is a 1% improvement in customer satisfaction." The First Call Resolution customer satisfaction connection is among one of the highest correlations of call center KPIs.
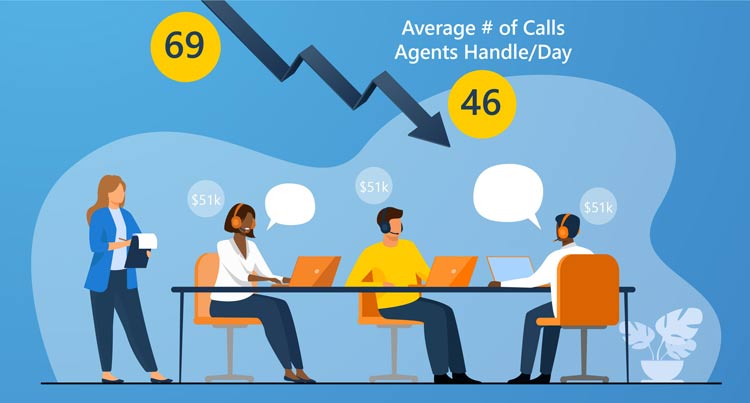
4. High Labor Costs and Call Complexity
The call center annual operating cost budget for participants in our operational data and practices study was 21 million dollars which is a modest increase from the previous year even though call volume has decreased. The key findings are that labor costs remain high at 63% of total operating cost. The average Agent's annual salary (including benefits) is $51k.
The average number of calls Agents handle per day is 46, which is substantially lower than the average of 69 calls per day experienced five years ago. The lower number of calls handled by Agents per day is being driven down from increased call complexity because the easier calls are being handled by self-service contact channels such as the IVR and website.
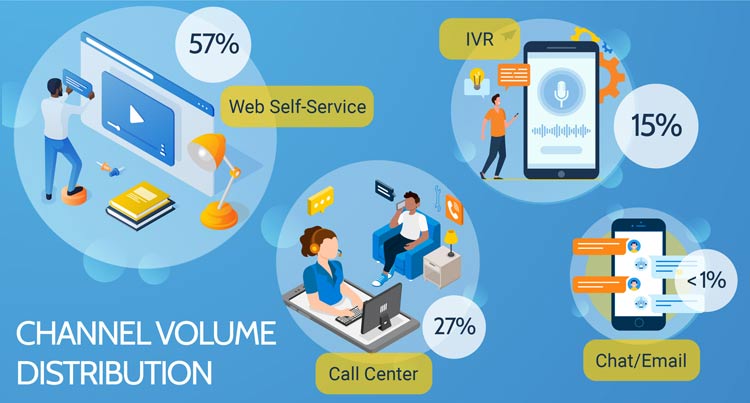
5. Channel Volume Distribution and Second Channel Used
The first revealing finding is that of all the core contact channels (i.e., call center, web self-service, IVR self-service, email, and chat), the web self-service channel has the highest contact volume at 57%. The call center channel volume is second highest at 27%, and the IVR self-service channel volume is the third highest at 15%. Email and chat channels are less than 1%. 55% of Agents handle multiple contact channels. However, SQM research shows Agents that specialize in one channel tend to have higher FCR.
SQM's research showed in most cases, when a customer used another contact channel to resolve the same inquiry or problem, it resulted from the initial contact channel's failure and not because the customer wanted to use another channel. However, when a customer uses a second channel to resolve their inquiry or problem, the call center is by far the channel of choice. This is because the call center handles the complex inquiries and problems that the other contact channels cannot resolve. In addition, the pattern of using the same contact channel to resolve an inquiry is highest by far with the call center channel. Most customers who start in one contact channel do not like to channel hop to resolve the same inquiry or problem.
Given so many customers are using multiple contact channels to resolve the same inquiry or problem, it is worth measuring the entire customer experience (CX) journey to resolve their issue. At SQM, we use a metric called One Contact Resolution (OCR) to measure the entire CX journey which is based on customers resolving their inquiry or problem on the first contact using only one contact channel. The data reveals that OCR is 11% lower than FCR.
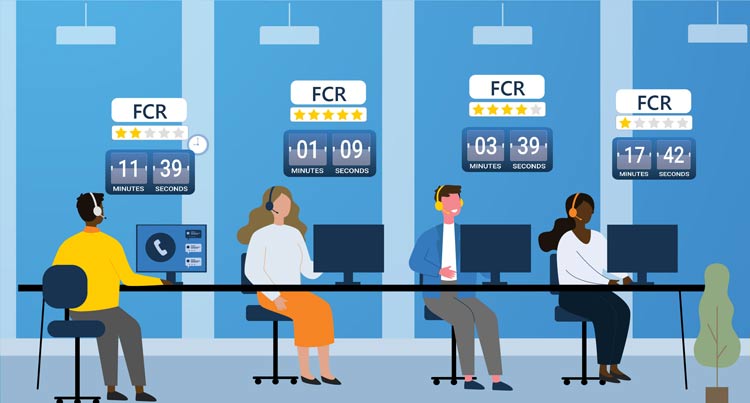
6. Call Length Impact on FCR
The average handle time (talk time + wrap-up time) is 424 seconds. SQM's experience is that less focus on AHT at the Agent level can help improve FCR. However, our data shows that Agents with the highest FCR have the lowest AHT among their peers in many cases.
SQM's call center industry research shows that the FCR rate is impacted by call length. Our research shows the FCR rate goes down the longer the call length. For example, the FCR rate for the 1 to 3-minute call length is 73% versus the more than 15-minute call length, where the FCR rate is 62%. Most call lengths are between 5 to 9 minutes for the call center industry. For those call lengths, the FCR rate is 69%.
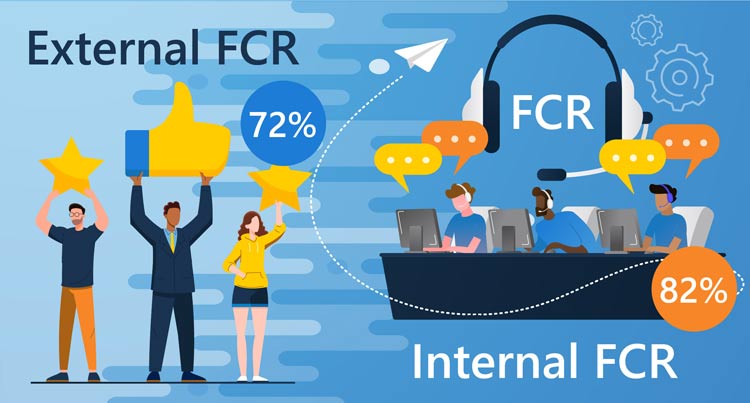
7. Internal FCR Rate Much Higher than External FCR Rate
Our research shows that the internal FCR rate average is 82%, versus their external FCR rate average of 72%. Not receiving a repeat call in a given timeframe is an internal FCR measurement method that uses an organization's criteria for determining its FCR rate. An internal FCR rate can overstate the FCR rate by 10 to 20% higher than the external FCR measurement (e.g., post-call survey) FCR rate. An inflated FCR rate can discourage leaders from wanting to improve FCR.
FCR has its critics. There has been a lot of criticism that FCR is complex and difficult to measure. There is no industry standard for internal measurement of FCR, which hinders the accuracy and benchmarking of FCR against other call centers. However, for the external measurement of FCR, an industry-standard is used and as a result, is more accurate for FCR benchmarking purposes.

8. Calls Pended for Resolution
Our research shows for incoming calls, 9% of them are pended for resolution. The majority of pended calls are 'claim call types.' SQM research shows that high pended calls percentage is a leading indicator for negatively impacting FCR performance.
Customers who have 'pending resolution,' 'open cases,' 'open trouble tickets,' or are calling within one to five days of their previous call should be flagged. Customers who have a call pended for resolution should be routed to a specialized Agent or the best Agents, who can provide appropriate status updates or resolve their call. These Agents should be empowered to make clear follow-up commitments to the customer to avoid the customer calling back for further status updates.
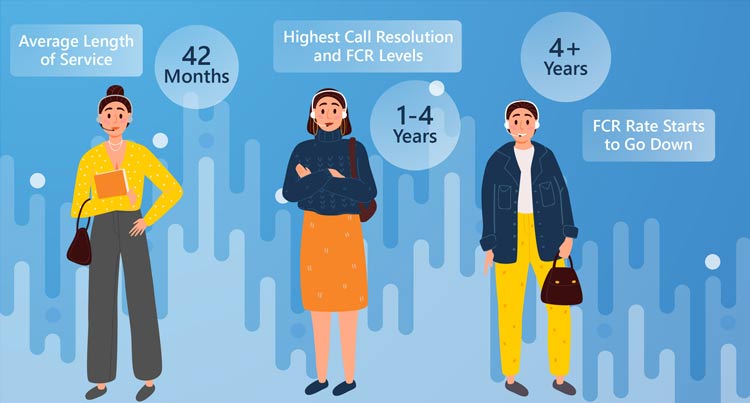
9. Long Agent Length of Service Can Negatively Impact FCR
Agent average length of service in months is 42 months. SQM research shows that call resolution and FCR are the highest levels for Agents in the one to four-year mark for length of service. The FCR rate starts to go down after the four-year mark for length of service. However, for our world-class call centers, Agents that have worked in the call center for more than four years have just as high or higher FCR rate than Agents with less than four years of service working in the call center.
World-class FCR performing call centers, in most cases, have high Agent satisfaction working in the call center. The leaders of world-class FCR performing call centers recognize that high Agent satisfaction equals high customer satisfaction and FCR.
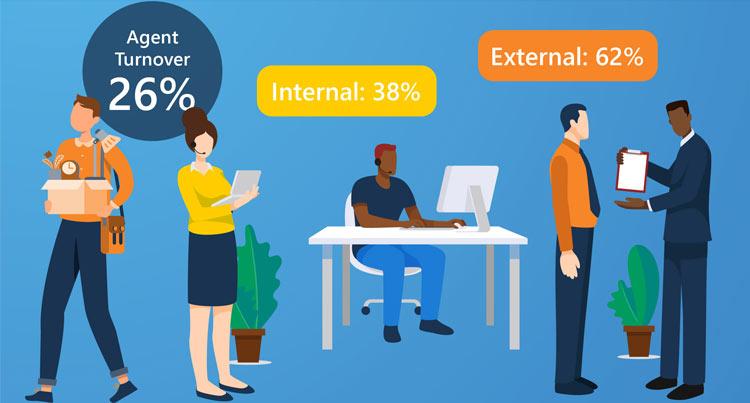
10. Internal Agent Turnover Impact on FCR
Annual Agent turnover is 28%. The breakdown for external Agent turnover (leave the organization) is 62%, and internal (leave the call center) is 38%. When we examine why FCR has gone down for a call center, one of the areas we evaluate is how much Agent turnover has taken place. In many cases, Agent turnover can be the biggest reason why FCR has gone down.
Many call centers hire Agents to have them eventually work in other departments outside the call center. The percentage of Agents with a university degree is 33%, with many of them taking a call center job so they can work in another department within one year. Put differently, the call center is hiring Agents for the mothership (e.g., other departments within the organization outside of the call center). Most call center leaders are very proud to have their department be used as an Agent springboard to other departments. However, from a customer perspective, too much internal Agent turnover can have a negative FCR impact.
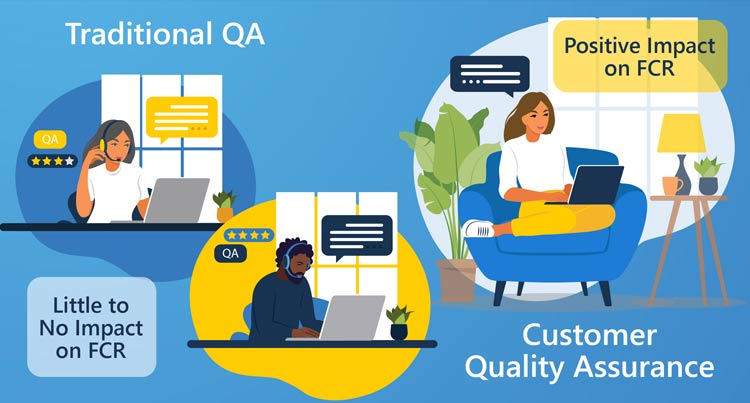
11. Traditional Quality Assurance has Little or No Positive Impact on FCR
Agents are evaluated on six calls per month assessed by a QA evaluator or their direct supervisor. Call recording, side-by-side, audio, and screen call monitoring methods are used in QA programs. SQM's research shows traditional QA programs have little or no impact on improving a call center's FCR rate.
Customer Quality Assurance (CQA) is a best practice for improving the impact of call monitoring on the call center's FCR rate as it allows the customer, not the organization, to determine whether FCR has taken place. The CQA program evaluates a call using both customer survey and call compliance metrics to assess call quality for the same call. By combining customer survey and call compliance metrics, the CQA evaluation provides a holistic view of quality assurance because it represents both the customer and the organization's perspective.
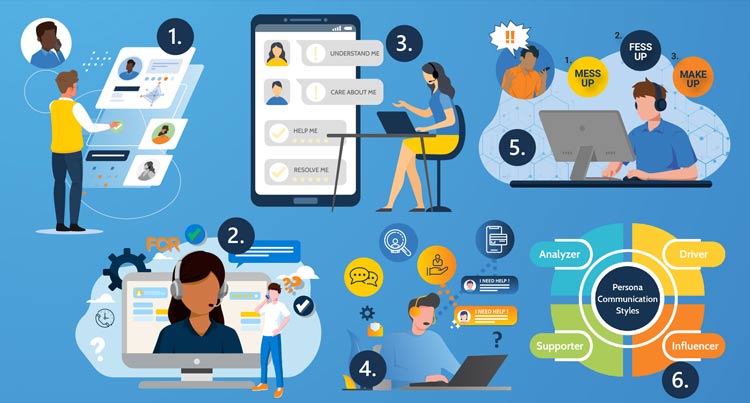
12. Essential Call Handling Practices Not Consistently Being Used
The operational data for agent call handling shows that the percentage of always doing warm transferring, asking the customer if they resolved their call, summarizing the call, providing concierge service, etc., is mediocre at best. SQM's research shows that approximately 40% of non-FCR the Agent was the source of error.
One of the quickest ways to improve FCR is to improve Agent call handling practices. Below are the Top 6 Call Handling Best Practices that have a proven track record of improving First Call Resolution:
- Intelligent Skill-based Routing
- The Shift from Average Speed of Answer to FCR Focus
- Call Resolution Delivery Model
- Concierge Service
- Complaint Handling
- Persona Communication Styles
Quick Related Links
First Call Resolution Definition First Call Resolution PPT First Call Resolution Benefits
First Call Resolution Strategies First Call Resolution Operating Philosophy FCR Case Study Agents Working from Home Cost Per Call Resolution Call Complexity Channel Volume Call Length Internal FCR Agent Average Length of Service Customer Quality Assurance Agent Call Handling