FCR and Csat Correlation Benchmarking Results
The below call center industry figures shows Voice of the Customer (VoC) First Call Resolution (FCR) and Customer Satisfaction (Csat) benchmarking results by industry and call reason. The VoC benchmarking data is based on a post-call survey method with over 500 leading North American call centers participating in SQM's annual customer-service benchmarking study.
Figure 1 shows that VoC FCR and Csat (top box response) performance is highly correlated with all industries. For every 1% improvement in FCR, there is a 1% improvement in Csat for call centers in most industries. For example, for specific industries such as:
- Retail FCR is at 78% with 81% Csat
- Insurance FCR is 76% with 80% Csat
- Health Insurance is 72% with 80% Csat
- Energy FCR is 72% with 76% Csat
- Financial FCR is 71% with 75% Csat
- Tech Support FCR is 65% with 75% Csat
- Telco FCR is 61% with 68% Csat

It is essential to take a closer look at the highest-performing industries. For example, while retail call centers tend to have lower call reason complexity (geared towards orders), the insurance industry has moderate to high call reason complexity yet can still achieve high performance regarding FCR and Csat metrics.
Energy, health care, and financial industries tend to have moderate call reason complexity and average performance for FCR and Csat. However, these same industries have some call centers that are performing at the world-class level. On the other hand, the tech support and telco industries have high call reason complexity and low FCR and Csat performance. The bottom line is that call reason complexity should not be used as an excuse why world-class customer service performance cannot be achieved.
Figure 1. FCR and Csat Comparison by Industry
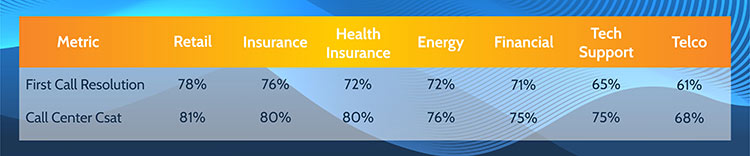
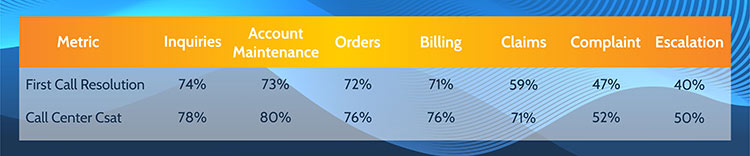
Figure 2 shows that VoC FCR and Csat (top box response) performance is also highly correlated over the different call reasons. For example, for specific call reasons such as:
- Inquiries FCR is at 74% with 78% Csat
- Account Maintenance FCR is 73% with 80% Csat
- Orders FCR is 72% with 76% Csat
- Billing FCR is 71% with 76% Csat
- Claims FCR is 59% with 71% Csat
- Complaint FCR is 47% with 52% Csat
- Escalation FCR is 40% with 50% Csat
Moreover, FCR is the highest correlated metric of all call center internal or external metrics to Csat. Put differently, FCR and call resolution are the strongest drivers for delivering great customer service for all call reasons. Therefore, you can make a strong business case that FCR is a proxy for world-class customer service.
Inquiries and account maintenance call reasons have the highest FCR and Csat ratings; however, they also have lower call reason complexity. Orders and billing have moderate call reason complexity; as a result, they have average FCR and Csat performance. Conversely, claims, complaint, and escalation call reasons have high call complexity, which results in the lowest FCR and Csat performance.
As a general rule of thumb, SQM uses average handle time (AHT), agent new-hire and existing training required, call flow, and desktop applications as the main determining factors for call reason complexity. However, from a customer perspective, they judge call reason complexity based on FCR. For example, the lower the first call resolution, the higher the call reason complexity (e.g., claims, complaint and escalation).
Another important aspect of call reason complexity is the emotional aspect of the call, especially for customers calling the call center with a complaint or an escalated call. These call reasons can have low or high AHT yet still have low FCR and Csat performance.
Figure 2. FCR and Csat Comparison by Call Reason
Quick Related Links
First Call Resolution Definition First Call Resolution PPT First Call Resolution Benefits
First Call Resolution Strategies First Call Resolution Operating Philosophy FCR Case Study Agents Working from Home Cost Per Call Resolution Call Complexity Channel Volume Call Length Internal FCR Agent Average Length of Service Pended for Resolution Customer Quality Assurance Agent Call Handling