
Top 10 Call Center Quality and Cost Metrics
Determining the top call center metrics and key performance indicators (KPIs) for measuring performance can be challenging for managers. In addition, many operational senior leaders struggle with demonstrating the call center's value to the C-level executives. Furthermore, many C-level executives view the call center as a cost center versus a profit center.
The goal of most call centers is to achieve the highest possible quality (e.g., customer service KPIs) at the lowest possible cost (e.g., financial KPIs). Therefore, many would argue that quality and cost are the measures that matter most for any call center. Consequently, it stands to reason that if senior call center management wants to determine performance or demonstrate their call center's value to C-level executives, reporting the quality and cost metrics is the right thing to do.
The call center plays an essential role in delivering customer service effectively and efficiently for many organizations. The right call center metrics and key performance indicators (KPIs) can help managers stay on track to ensure the customer service goals are achieved. For example, executives need strategic KPIs to understand performance for the business case to determine resource allocation. In contrast, operational managers need KPIs to make day-to-day decisions about the workforce and customer service delivery.
The top 10 call metrics and KPIs are not ranked for importance because a call center can have a unique strategic and operational focus, resulting in specific call metrics being more important KPI to them (e.g., NPS versus customer retention).
Moreover, the top 10 call metrics are based on SQM's experience of measuring and benchmarking over 500 leading North American organizations and surveying over 5 million customers who used a call center. SQM has been conducting call center customer service and cost benchmarking studies since 1996.
In the world-class call centers that SQM has worked with, we have never seen an issue where senior call center management struggled with demonstrating how the call center added value to the organization. In world-class call centers, senior managers demonstrate the value that the call center brings to the organization by explicitly showing the performance using 10 call center metrics and KPIs.
The following are the top 10 call center metrics, representing five customer service KPIs and five financial KPIs that managers can use for measuring performance and present to organizational executives to demonstrate the call center's value.
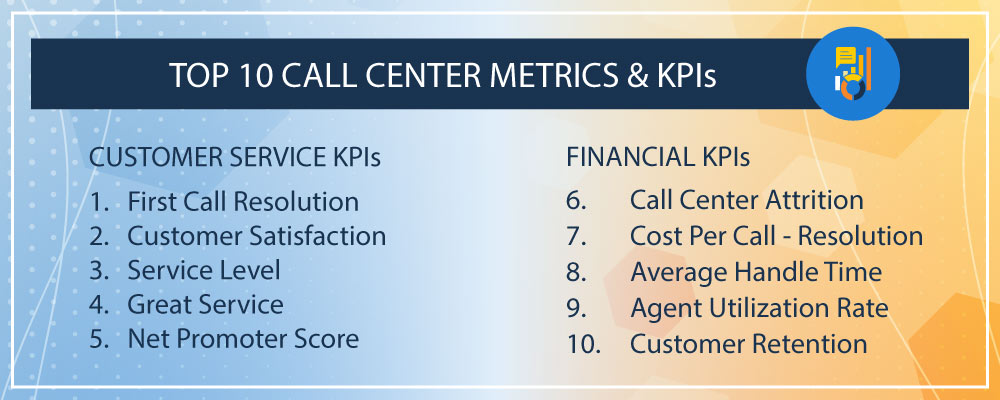
Top 10 Call Center Metrics & KPIs
Call Center Customer Service KPIs
- First Call Resolution
- Customer Satisfaction
- Service Level
- Great Service
- Net Promoter Score
Call Center Financial KPIs
- Call Center Attrition
- Cost Per Call - Resolution
- Average Handle Time
- Agent Utilization Rate
- Customer Retention
Customer Service KPIs

First Call Resolution (FCR) is a metric that measures a call center's ability for its agents to resolve a customer's inquiry or problem on the first call. FCR is a great metric to show C-level executives the value a call center provides to the organization. The benchmark average for the FCR metric is 71%, and a world-class FCR standard is 80%. Many leaders consider the FCR metric as the most important call center metric.
Managers use many call metrics and KPIs to measure and manage their quality and cost. However, the First Call Resolution metric should be considered the most crucial call center metric of all metrics and KPIs because it measures efficiency (e.g., cost) and effectiveness (e.g., quality).
The FCR metric should be considered a balanced scorecard metric because it measures efficiency and effectiveness. For example, SQM Group's research shows for 1% improvement in FCR, you reduce operating cost by 1%, and for every 1% improvement in FCR, there is a 1% improvement in customer satisfaction. The FCR and customer satisfaction connection is among the highest correlations of call center KPIs.
Letting the customer judge whether or not the call was resolved on the first call is a best practice. Therefore, customers are asked whether the issue was resolved on the first call using a post-call survey to determine the first call resolution rate. The FCR questions are asked using survey methods such as email, Interactive Voice Response (IVR), or a phone interviewer.
The First Call Resolution rate calculation is the total number of customers who said their call was resolved on the first call (284) divided by the total number of customers surveyed (400) = 71% First Call Resolution rate.


Customer Satisfaction metric measures a customer's experience trying to resolve an inquiry or problem using a call center. The benchmark average for the call center customer satisfaction (Csat) very satisfied (top box rating response) metric is 77%, and a world-class Csat standard is 85%. Csat has been the most widely used and understood customer experience (CX) metric of all the voice of the customer (VoC) metrics.
The Csat is a commonly used metric to measure customers' satisfaction with the call center and agent service. SQM uses a 4-point satisfaction scale with "very satisfied" anchoring the highest point of the scale and "very dissatisfied" anchoring the lowest end of the scale. SQM uses the very satisfied top box response rating for determining the Csat score because anything less than Csat top box response represents an opportunity for improvement.
The Customer Satisfaction score calculation is the total number of customers who said they are very satisfied (top box rating response) (308) divided by the total number of customers surveyed (400) = 77% Csat top box response score.


Service Level metric measures a call center's ability to answer a certain number of calls in a predetermined amount of time, making it an essential call center metric.
Measuring your service level will give you actionable insight into how your call center performs. For example, you can see how easy it is for customer calls to get through and then shift agent staff accordingly. A poor service level means having some internal issues that need to be fixed.
SQM research shows in most cases that there is no Csat penalty for calls answered within 120 seconds. Put differently, if a customer's call is answered by an agent between 1 and 120 seconds, there is no positive or negative impact on Csat. Therefore, from a CX perspective, the standard for service level should be the percentage of calls answered within 120 seconds.
The Service Level score calculation is the total number of calls answered within 120 seconds (2,500) divided by the total number of calls (4,000) = 63% Service Level score.


Great Service is based on a customer's call center experience and how they rate their overall relationship with the organization. For example, if great service is achieved, the customer would rate their overall relationship with the organization as "great," which is a top box rating response based on their call center experience. The benchmark average for great service (top box response) score is 53%, and a world-class great service standard is 65% for customers who used a call center.
SQM uses a 5-point Great Service scale with "great" anchoring the highest point of the scale, followed by "good, average, poor" and "very poor," anchoring the lowest end of the scale.
Based on a customer's experience (CX) using a call center, only 5% of SQM clients have a great service rating of 65% or higher, which we consider world-class performance. Many call centers provide good CX but strive to deliver great CX at the world-class level.
Great customer relationships help organizations grow their business and sell their products and services at a premium price. To go from good to great CX, it is essential to measure great service on an ongoing basis to understand performance trends and improvement opportunities.
The great service metric is easy to measure and communicate internally to executives and front-line staff and is a metric that people can rally behind. Many call centers provide good service but are striving to provide great service or put differently, going from good to great. The value of the great service metric is that it helps determine whether or not a call center is providing great service.
The Great Service score calculation is the total number of customers who said their CX was great (top box rating response) (260) divided by the total number of customers surveyed (400) = 65% Great Service score.


Net Promoter Score (NPS®) is an important metric because it measures customers' likelihood to recommend the organization to others. The benchmark average for the transaction NPS® metric is 48, and a world-class NPS standard is 60 for customers who used a call center.
Net Promoter Score is widely used by many leading North American companies. In many cases, it is the most critical metric they use for measuring CX and understanding the impact that CX has on customers' likelihood to recommend the organization to others.
Based on the customer perspective, organizations performing at the world-class level for FCR (80% or higher), their transactional NPS is 60 points or higher. However, only 5% of call centers have achieved the FCR world-class standard of 80%.
NPS for the call center customer experience is based on a post-call transactional survey. Conversely, the organizational NPS is based on a perceptional survey that focuses on a customer's overall experience doing business with an organization.
NPS transactional surveys can be as short as one question, asking how likely customers will recommend your organization to others. In addition, they can be expanded to include more questions to understand better what your customers like/dislike.
Customers who complete the NPS survey question fall into one of three categories:
- promoters (customers who give a score of 9 or 10)
- passives (customers who give a score of 7 or 8)
- detractors (customers who give a score between 0-6).
The Net Promoter Score is calculated by subtracting the score of promoters from the score of detractors (the score of passives is not used in the calculation). For example, the NPS calculation is the score of promoters (64) minus the score of detractors (16) = 48 NPS.

Financial KPIs

Call center attrition and turnover are related terms that refer to the departure of agents from a call center. While they are often used interchangeably, there is a subtle difference between the two:
Call Center Attrition metric refers to the rate at which employees leave the call center over a specific period. It represents the overall percentage or number of employees who voluntarily or involuntarily leave the call center. Attrition can occur due to various reasons such as resignation, retirement, termination, or transferring to another department within the same company.

Call center turnover, on the other hand, specifically focuses on the rate at which employees voluntarily leave the call center, typically through resignation. It measures the number or percentage of employees who choose to leave their positions within a given time frame. Turnover is often calculated separately from attrition to understand the voluntary departure trends and evaluate factors contributing to employee dissatisfaction or disengagement.
Furthermore, call center attrition is at an all-time high, impacting the efficiency and effectiveness of operations more than any other performance metric. Usually, call center turnover significantly strains operating costs and budgets.
The call center costs to replace an existing average-performing agent are significant and include hiring (e.g., recruiting, interviewing & selecting), training (e.g., onboarding, training & coaching), productivity (e.g., higher average handle time), and CX Impact (e.g., lower call resolution).
Furthermore, in many other areas, call center turnover negatively impacts that are more difficult to measure, such as CX impacts on company brand reputation, referrals, and retention. You can argue that the call center turnover costs associated with negative CX can have substantially higher costs than the above (e.g., hiring, training, and productivity) to replace an average-performing agent.
The below figure shows the average call center turnover costs per agent. The data shows the average call center turnover cost per agent is $20,800 to replace an average-performing agent. The cost percentage in the figure is an average cost breakdown for the call center industry, and there can be significant differences for your call center due to your call center's operating practices and performance.
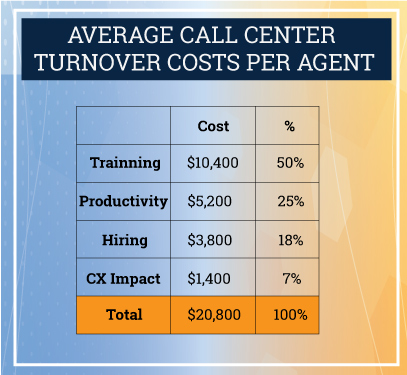
The cost of hiring, training, and being productive to replace an average-performing agent is 30% to 50% of a new agent's salary. For example, if the agent's salary you hired is $52,000 and your total cost is $20,800 to make them perform at the same level as an average performing agent, your call center attrition cost per agent is 40%. Furthermore, on average, it takes six months or more for a new agent to perform at the same level as an intermediate agent.

Cost Per Call - Resolution (CPC-R) metric measures the call center's efficiency for resolving calls. The difference between the traditional CPC metric and CPC-R is that the latter factors the number of calls needed to resolve an inquiry or problem. For example, the average FCR rate is 71% for the call center industry, with an average number of 1.4 calls to resolve an inquiry.
The cost per call differences between the average and world-class call centers is minimal. However, the cost per call - resolution difference between the average and world-class call centers is substantial. Because world-class call centers have such high FCR performance, they have been able to have a 20% lower cost per call - resolution than the average call center in North America. World-class call centers have proven that providing great customer service can lower call center operating costs.
Measuring the CPC-R over a month is a good starting point, as it's enough time to measure common trends. The CPC-R calculation is the total annual/monthly operating expenses (e.g., fully loaded cost) of the call center divided by the volume of calls made in the same period, times the average number of calls to resolve an inquiry.
For example, the CPC-R metric calculation is total annual/monthly operating expenses of the call center ($860k) divided by the volume of calls made in the same period (100k), times the average number of calls to resolve an inquiry (1.4) = $12.04 Cost Per Call - Resolution.


Average Handle Time (AHT) metric measures the average time for an agent to resolve a customer issue or problem. AHT starts when an agent answers the customer's call and ends after wrapping up the call. The AHT metric should be tracked at the agent level and used for coaching and improving CX. Moreover, AHT should also be tracked by call types, lines of business, teams, and call centers to determine performance and identify opportunities for improvement.
Shorter call lengths typically correlate with higher Csat and lower cost, which is why this metric is essential for call center success. However, it's important to remember that shorter AHT isn't necessarily a success criterion, as having agents rush through calls could lower FCR and Csat while increasing cost.
Many call center's hold their agents accountable to AHT goals. However, holding agents responsible for the AHT metric performance can create agent behaviors that rush calls resulting in lower Csat and FCR.
Average handle time is calculated based on total agent talk time, plus total customer hold time, plus total after-call tasks, divided by the number of total calls.
For example, AHT calculation is based on agents' talk time (6 million) minutes + total customer hold time (300k) minutes + total after-call tasks (180K) minutes, divided by the total number of calls (926k) = 7 minutes Average Handle Time.


Agent Utilization Rate (AUR) metric is measured by dividing work performed by work capacity. Call centers are a labor-intensive function, and as a result, they need to make sure agents are efficiently using their time. The AUR metric allows call centers to assess the usage of their agent workforce. A good agent utilization rate is 70% to 75%.
The average call center AUR is 71%, and the average world-class call center AUR is 69%. Call centers that perform at the 80% or higher AUR level experience high agent turnover because there is too much pressure on agents taking on too many calls. Conversely, low AUR can also be problematic because some agents are laid back or inefficient in handling calls.
Agent utilization rate calculation is determined by dividing the amount of work performed by work capacity. For example, an agent's average number of calls handled in a month (900) x average handle time (7 minutes), divided by workdays in the month (20) x total work minutes in a day (450) = 70% agent utilization rate.


Customer Retention is an important metric because it measures customers' likelihood to continue to do business with the organization due to their call center experience. At SQM, to measure customer retention, we use a metric called Net Retention Index (NRI). The benchmark average for the transactional NRI metric is 68%, and a world-class NRI standard is 80% for customers who used a call center.
It has long been SQM's belief that customer retention should be one of the primary purposes of most call centers, especially when you consider that, in many cases, a call center is the last line of defense to stop a customer from defecting.
Research shows that acquiring a new customer costs five times more than retaining an existing one. As a result, many organizations focus on retaining customers to avoid high customer acquisition costs. SQM Group's research shows 95% of customers expressed intent to continue doing business with an organization when FCR is achieved.
NRI for the call center customer experience is based on a post-call transactional survey. Conversely, the organizational NRI is based on a perceptional survey that focuses on a customer's overall experience doing business with an organization.
NRI transactional surveys can be as short as one question, asking how likely customers will continue to do business with your organization due to their call center experience. In addition, they can be expanded to include more questions to understand better what your customers like/dislike.
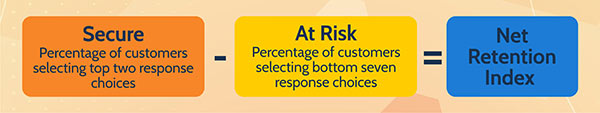
Customers who complete the NRI survey question fall into one of three categories:
- Secure (customers who give a score of 9 or 10)
- Favorable (customers who give a score of 7 or 8)
- At-risk (customers who give a score between 0-6)
Net Retention Index is calculated by subtracting the score of secure from the score of at-risk (the score of favorable is not used in the calculation). For example, the NRI calculation is the score of secure (78) minus the score of at-risk (10) = 68 NRI.
Quick Related Links
First Call Resolution Definition First Call Resolution PPT First Call Resolution Benefits FCR Case Study Survey Data Intelligent Skill Based Routing 5 Benefits of Journey Mapping CX Pulse Check Top 10 CX Metrics FCR Strategy Options VoC Closed-Loop Outside-In or Inside-Out Journey Mapping Good to Great Customer Service