First Call Resolution (FCR) Comprehensive Guide
Most call centers aim to deliver great customer service at the lowest cost. This call center FCR blog is a comprehensive guide for defining, measuring, tracking, benchmarking, and improving FCR to deliver a great customer call center experience at the lowest cost.
The FCR guide was developed based on SQM Group's over 25 years of measuring, benchmarking, and improving FCR with leading North American call centers. SQM is considered the thought leader and the gold standard for the call center industry to measure, benchmark, and improve FCR. This call center FCR comprehensive guide will answer the following primary (5) First Call Resolution and related questions.
Discover the following:
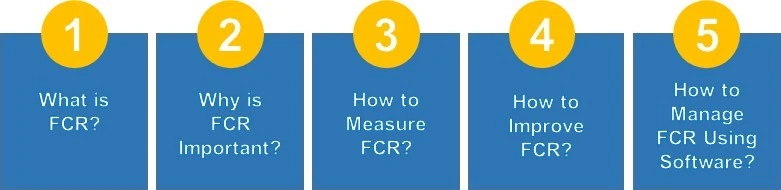
- What Is Call Center First Call Resolution?
- Why Is First Call Resolution Important?
- How to Measure First Call Resolution?
- How to Improve First Call Resolution?
- How to Measure and Improve FCR Using Software?
Call Center FCR Comprehensive Guide Questions
1. What Is First Call Resolution?
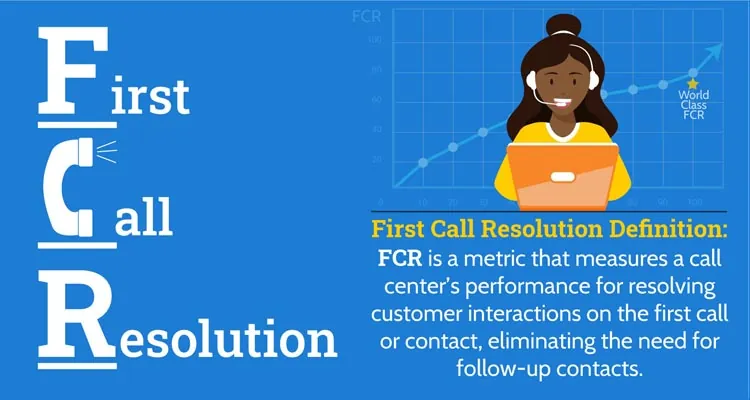
First Call Resolution (FCR) is a metric that measures a call center's performance for resolving customer interactions on the first call or contact, eliminating the need for follow-up contacts. FCR measures the percentage of calls resolved on the first contact without requiring follow-up. High customer satisfaction scores correlate with high FCR rates, as customers value their inquiries or problems resolved quickly and efficiently.
SQM Group’s research shows that the number one thing customers expect from call centers is the fast resolution for resolving their inquiries or problems. Furthermore, First Call Resolution, Average Handle Time (AHT), hold times and call transfer rates are essential metrics to monitor because they all relate to a fast resolution for resolving their inquiries or problems.
The First Call Resolution rate is the percentage of customers who resolved their touchpoint interaction on the first call or contact. Therefore, each touchpoint should measure the FCR rate. SQM's experience shows that there can be significant FCR rate differences among the touchpoints an organization uses to serve its customers.
Ideally, the First Call Resolution definition means no repeat calls or contacts are required for follow-up from the initial call or contact reason from a customer journey perspective.
We are often asked, "What is the difference between call resolution and First Call Resolution metrics?" The call resolution metric is a Key Performance Indicator (KPI) that measures if the customer interaction was resolved, versus FCR measures if the customer interaction was resolved on the first call.
First Call Resolution and First Contact Resolution are commonly used interchangeably. The First Call Resolution metric name is typically used when measuring the FCR rate for the phone or IVR touchpoints. On the other hand, the First Contact Resolution metric name is often used to measure the FCR rate for touchpoints (e.g., email, chat, website, retail).
One Call Resolution (also known as one contact resolution) measures an organization's performance in resolving customer interactions on the first call or contact using only one touchpoint. One Contact Resolution (OCR) metric uses tougher criteria than the FCR metric because it considers all touchpoints (e.g., call center, website) used to resolve the same interaction. Conversely, the FCR metric only measures CX using one touchpoint (e.g., call center) to resolve the same interaction. Typically, OCR is 10% or lower than FCR.
First Call Resolution Reimagined Part 1
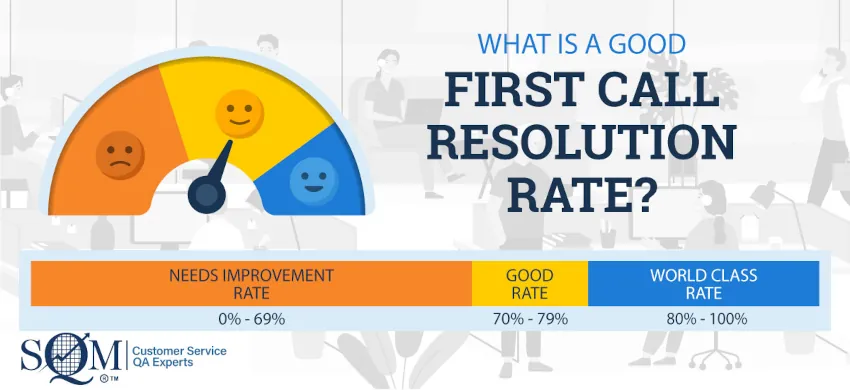
What is a Good Benchmark First Call Resolution Rate?
Based on a post-call survey method, the Call Center Industry benchmark average for the First Call Resolution rate is just under 70%. The FCR rate means that 30% of customers have to call back the organization about the same inquiry or problem.
The First Call Resolution industry standard for a good FCR rate is 70% to 79%. Therefore, call centers with an FCR rate below 70% need improvement. Conversely, the World-class FCR rate is 80% or higher, and only 5% of call centers can achieve the World-Class FCR Rate from a CX journey perspective.
It is important to emphasize that the FCR rate varies by contact centers, call types (e.g., billing, claims, orders, inquiries, technical), lines of business, and industries. Furthermore, the FCR rate can differ due to how the FCR rate is measured.
It is essential to mention that customers using your call center are not only comparing you to your direct competitors. But instead, in many cases, they compare you to the best customer service they have had with their favorite companies from any industry.
Call Center Benchmarks
SQM Group’s 2025 research found the aggregated average across all industries for the FCR benchmark is 70%. The industry call center benchmarks for the FCR rate range from 50% to 90%. Industries with low call complexity, such as retail and not-for-profit, have the highest FCR rates; conversely, industries with high call complexity such as tech support and telcos, have the lowest FCR rates. However, it is not uncommon for industries or call centers that have high complexity to have high FCR performance.

The correlation of FCR to CSAT remains high. Since 2013, when FCR goes up or down, so does CSAT. However, a trend in recent years is that the gap between FCR and CSAT has started to widen. For example 2013, the FCR and CSAT gap was 4%. Conversely, the FCR and CSAT gap was 8% in 2025.
SQM's view for why the FCR and CSAT gap has been widening in recent years is increased call complexity due to higher usage of self-service touchpoints (e.g., website, chat, IVR) handling the lower complexity calls. In addition, many customers do not punish call centers with lower CSAT as much as they used to when not experiencing FCR because they recognize their call reason is complex. However, it is crucial to note that the First Call Resolution rate is a reliable predictor of customer satisfaction.

Contact Us for a Benchmark Demo
A senior SQM consultant will share an example of the benchmark report, which includes methodology, your performance for KPIs and metrics, benchmark comparison, and targeted opportunities for improvement. In addition, you will have the opportunity to get a free trial with mySQM™ Customer Service QA Software using your own data.
Challenges of Achieving a Good FCR Rate
There are many challenges to achieving a good First Call Resolution rate. At SQM, we identified the three primary sources of errors (SOE) that hinder a high FCR rate:
- 38% are due to agent mistakes
- 13% are due to miscommunication by the customers
- and 49% are because of organizational policies and procedures
- When a customer is dissatisfied 9 out of 10 times, it is because FCR did not occur
- In any given year, approximately 40% of customers defect to another company because FCR did not occur
Furthermore, SQM research shows that the top five root causes of repeat call reasons that hinder a high FCR rate and great customers service are:
- A customer needed to verify or check the status of their unresolved issue
- While the customer was on hold, they got disconnected
- Agent lacked the knowledge to resolve the issue
- The customer request was not made
- The customer was redirected to a 3rd party
Improving or achieving a high FCR rate requires call center leadership to be FCR obsessed to enhance the support experience for agents, customers, and the organization. Furthermore, it is essential to determine the root causes of repeat calls to resolve the same inquiry or problem.
Moreover, numerous factors affect a call center's FCR rate, including agent turnover, call volume, average handle time, calls transferred, work from home (WFH), labor shortages, motivation, coaching, and agent training. SQM also believes that the number one hindrance in 2025 to achieving a good FCR rate is the historically high agent attrition, the turnover rate of 38%, and job burnout.
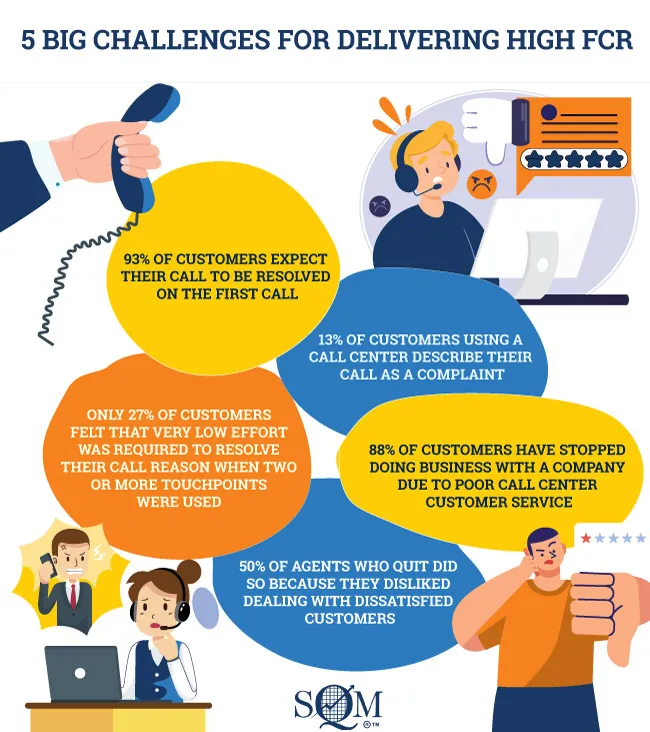
In addition, here are five big challenges for delivering high FCR:
2. Why Is First Call Resolution Important?
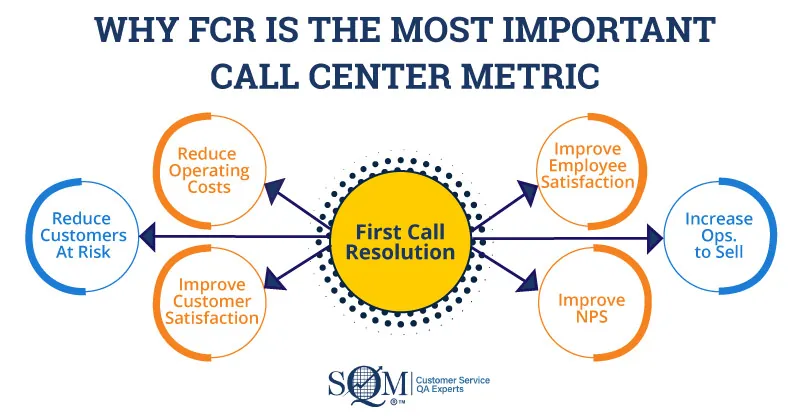
At SQM, we are often asked, "Why is call center First Call Resolution important?" The answer is that FCR is not only a measure of customer service effectiveness but also measures a call center's operating efficiency. No other metrics provide effectiveness and efficiency insights to the level that FCR does. Furthermore, the First Call Resolution metric should be considered the most important call center metric of all metrics and KPIs due to the following positive impact areas when an increased call center FCR rate takes place:
- Reduces operating costs
- Reduces customers at risk of defection
- Improves customer satisfaction
- Improves employee satisfaction
- Increases opportunities to sell
- Improves Net Promoter Score
Below is an infographic of why FCR is the most important call center metric:
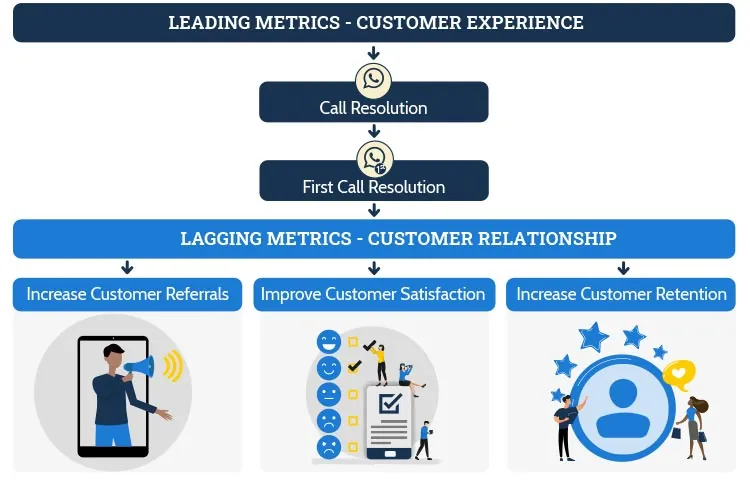
Furthermore, FCR is the KING of all call center metrics because it is a leading predictor for business outcomes due to their CX. For example, customers who experience call resolution and FCR are more likely to be very satisfied, continue to do business, and recommend the organization to others due to their customer call center experience.
Customer relationship metrics such as CSAT, referrals, and retention are lagging KPI outcomes and cascade from call resolution and FCR leading KPIs. Another essential point is that the correlation between the FCR and call resolution leading metrics and lagging metrics (e.g., CSAT, customer referrals, and retention) is among the highest for call center metrics.
The bottom line, when FCR performance is high or low, so too are the performances of CSAT, customer referrals, and retention.
The business case of the FCR metric importance is so high that some enlightened leading North American organizations have used it as an enterprise-wide metric for performance accountability, including at the CEO level. The general belief with the call center FCR metric is that it is a good indicator of a company's policies, procedures, and technologies efficiency and effectiveness for CX delivery.
Leading/Lagging KPIs of Call Center CX
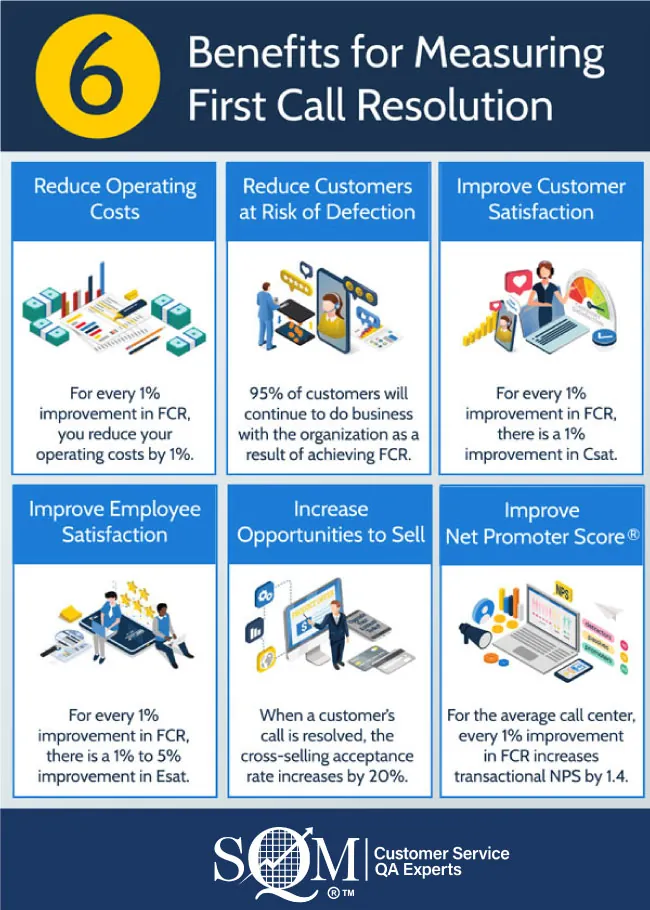
6 Benefits of Measuring First Call Resolution
The benefit of the FCR metric is that you gain tremendous insights into how customers view your organization's performance for efficiency and effectiveness metrics. For example, FCR performance correlates to your operating efficiency (e.g., cost per call resolution) and customer service effectiveness (e.g., CSAT, retention, referrals). Put differently, when your FCR is high or low, so are your operating costs and customer service.
SQM's call center CX research shows the following six benefits for measuring benchmarking, tracking, and increasing the First Call Resolution rate are the following:
- For every 1% improvement in FCR, you reduce your operating costs by 1%.
- 95% of customers will continue to do business with the organization due to achieving FCR.
- For every 1% improvement in FCR, there is a 1% improvement in customer satisfaction.
- For every 1% improvement in FCR, there is a 2.5% improvement in employee satisfaction.
- When a customer's call is resolved, the cross-selling acceptance rate increases by 20%.
- Every 1% improvement in FCR increases transactional Net Promoter Score® by 1.4 points.
Below is an infographic of the six benefits of measuring and improving First Call Resolution:
3. How to Measure First Call Resolution?
As the old saying goes, you can't improve what you don't measure and can't measure what you can't define. Therefore, it's up to an organization to define, measure, and calculate the First Call Resolution rate.
First Call resolution rate can be difficult to define and calculate. The main reasons the FCR rate is challenging are to nail down the criteria for defining it, measuring it, and determining when a call is resolved (e.g., 1 to 30 days from the initial call).
Our research shows that over 70% of call centers that measure, benchmark, and track the FCR rate for one year or more experience a 1% to 10% annual increase in their FCR rate. A 1% improvement in their FCR rate equals $286,000 in annual operational savings for the average midsize call center.
The key is to develop your data-gathering criteria by answering specific questions to define and measure the FCR rate. Also, it is helpful to use First Call Resolution analytics tools like mySQM™ Customer Service QA software to measure and manage FCR.
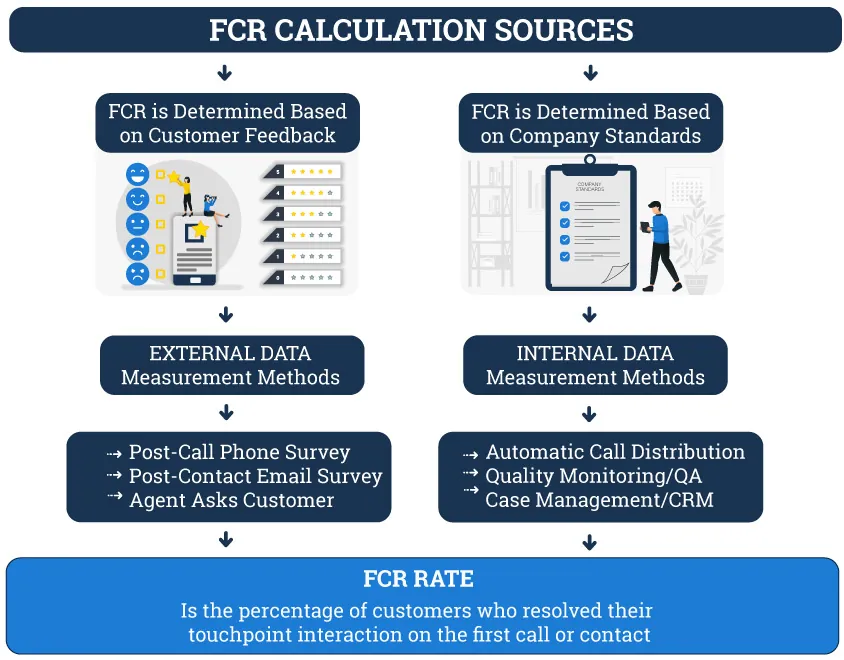
Below are the common practices for measuring and calculating external and internal First Call Resolution rates.
First Call Resolution - external measurement is considered the most accurate method for measuring and benchmarking FCR. In addition, external FCR measurement lets the customer decide if First Call Resolution took place; after all, their opinion matters most.
In most cases, a post-call phone or email survey method is used as an external FCR measurement Voice of the Customer (VoC) listening post. It is also common for agents to ask a customer if they have resolved their call. The phone and email survey external FCR methods use standardized questions and measurement methodology so you can benchmark the First Call Resolution rate against other organizations' call centers.
First Call Resolution - internal measurement can be insightful for trending First Call Resolution and is widely used by contact centers. Based on organization criteria, the FCR rate is determined. However, because the organization uses its own chosen internal standard for measuring FCR, the FCR rate, in most cases, is not benchmarkable against other organizations' call centers.
It is common for the internal FCR measurement to use automatic call distribution, CRM, case management, QA, and repeat call technology methods to determine the FCR rate. The internal FCR rate is based on whether the customer calls back for the same issue within 1 to 30 days. However, choosing the appropriate call-back time can be difficult, and as a result, there is no standard for internal FCR measurement, making the FCR rate less accurate and can inflate the FCR rate.
First Call Resolution Measurement Methods
How is First Call Resolution Rate Calculated?
Below is the First Call Resolution rate formula used to calculate the FCR rate:
First Call Resolution Formula Rate
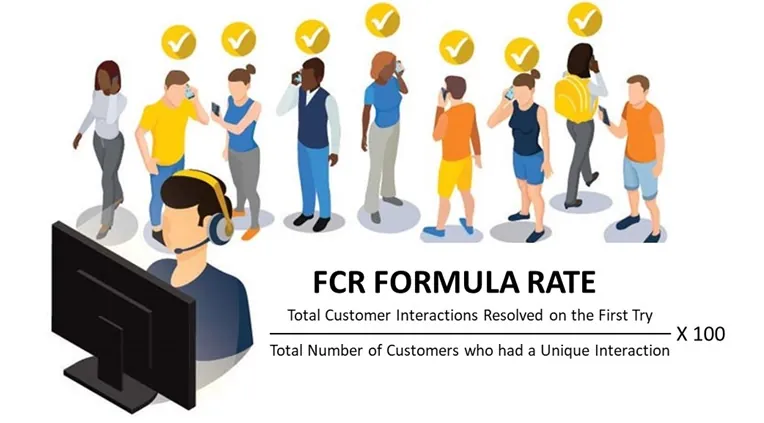
First Call Resolution formula rate is based on calculating the Total Customer Interactions Resolved on the First Try, divided by the Total Number of Customers who had a Unique Interaction, and then multiplying the result by 100 to get a percentage.
For example, a call center resolved 280 customer interactions on the first try in a single day. For that day, a total of 400 customers called with a unique interaction. Therefore, the FCR rate (280 ÷ 400) that day was 70%.
The First Call Resolution formula rate applies to internal (e.g., QA, CRM, case management, ACD) and external (e.g., post-call survey) FCR data measurement methods.
4. How to Improve First Call Resolution?
Most call centers' primary goal is to improve First Call Resolution. Moreover, SQM's CX research shows that 93% of customers expect their call to be resolved on the first call.
Given that the customers expect to resolve their inquiry or problem on the first call and the desire of most call centers to reduce cost, the FCR metric has been an essential method for measuring and managing service and cost.
For the cost-effective delivery of great customer service, many call centers use an "FCR operating philosophy as a way they work for their core people, processes, and technology practices" at the call center and enterprise levels. Put differently, the delivery of FCR is embedded into their operating practices.
The top 10 call center best practices for improving First Call Resolution are based on our customer and employee FCR research. Based on benchmarking leading North American call centers, we identified organizations with best practices that helped them deliver world-class or significantly improved their FCR rate.
In addition, SQM conducted site visits with most of the call centers that have experienced FCR success to validate that their practices have a proven track record for improving FCR or maintaining world-class FCR performance. Below are the top 10 First Call Resolution tips to improve the FCR rate and award-winning call center company links to their corresponding FCR best practice case studies.
Top 10 FCR Improvement Tips — Case Studies
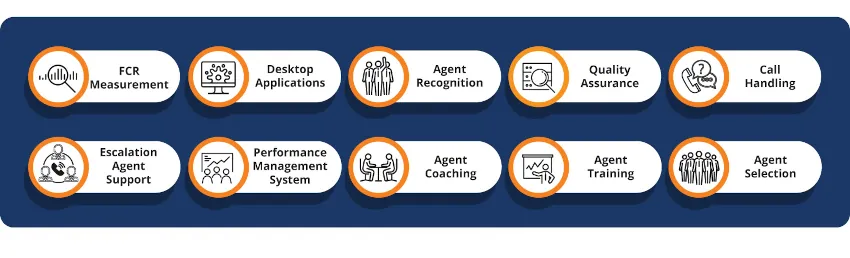
1. FCR Measurement
A large American Health Care Insurance Plan treats FCR as more than just a metric; FCR is an operating philosophy or sometimes referred to as FCR services. Therefore, they have incorporated the "FCR operating philosophy" into their core people, processes, and technology operating practices at the organization and call center level. In addition, they are focused on measuring, benchmarking, and tracking FCR at all levels within the enterprise to ensure accountability and delivery of FCR to their customers. As a result, for five consecutive years, they were certified as world class FCR Performers.
2. Desktop Applications
Comcast consolidated more than 20 unique desktop applications into one universal employee application that would be consistent, simple, smart, and agents would love to use it daily. They call their desktop application Einstein. 91% of agents trust the information on their desktop application.
3. Agent Recognition
A large American Health Care Insurance Plan has a Service Hero program that is their most successful and longest-running employee recognition program. The Service Hero program recognizes agents who provide exemplary service and have a proven track record for helping achieve great FCR and CSAT results at the call center and the organizational level. They have consistently been first-quartile FCR and employee satisfaction performers.
4. Customer Quality Assurance (CQA)
407 ETR agents have a holistic view of customer experience. Their CQA evaluation form embeds post-call customer surveys and call compliance results. For the same call, agents are accountable for customer survey and call compliance results. The CQA call evaluation model has the best track for improving the FCR and CSAT of any QA evaluation model. When QA is effectively implemented, you can expect a 5 to 15% FCR increase.
5. Call Handling
Canadian Tire delivering consistently high-quality service experiences is a philosophy woven into the fabric of the organization’s “Customers for Life” culture. As a result, every agent at their award-winning call center is fully aligned with the mission to deliver world-class customer service and is accountable for FCR and CSAT. In addition, customers can be authenticated through the IVR, where they go through a validation process before routing to the desktop. As a result, an agent can move right into helping the customer with the reason they called. The IVR also routes customers to agents with the right skill sets to assist them, which avoids the customer having to be transferred. As a result, they have won call center of the year seven times, and the average tenure for agents is 12 years. In addition, they have won more customer service awards than any other call center.
6. Escalation Agent Support
A large American Health Care Insurance Plan handles escalated calls using a Service Solutions Line. Escalation call tracking identifies which agents called and why, allowing them to identify training opportunities at both the individual agent and department levels. For five consecutive years, they were certified as world class FCR Performers.
7. Performance Management System
Scotia iTRADE post-call survey results (e.g., CSAT, FCR) are the primary metrics for measuring performance at all levels throughout the call center. In addition, agent performance appraisals, compensation, and improvement plans are based on post-call survey results. The performance management system uses post-call surveys and has the best track record of all best practices for improving FCR and CSAT quickly. For five consecutive years, their FCR and customer satisfaction significantly improved.
8. Agent Coaching
Mr. Cooper uses a coach-the-coach approach. They use a coaching feedback grading form to evaluate and score their coaches' effectiveness by rating them on very specific criteria. The coaches are observed by their VP weekly and given a score of 0%-100%. As a result of the agent coaching program, they have improved their FCR rate by over 50%.
9. Agent Training
A large American Health Care Insurance Plan agents attend a call resolution training workshop. Agents receive feedback based on VoC surveys. After each agent reviews their VoC results, they meet with other agents to discuss their learning and develop a call resolution improvement plan. As a result, 70% of agents improved the call resolution rate, and five years of improvement for FCR rate and customer satisfaction performance.
10. Agent Selection
Canadian Tire Financial Services management prides itself on hiring the best agent candidates who fit their culture and provide excellent customer experience. Cultural fit is key to a candidate's success, and the effect on FCR and CSAT can be directly linked to this fit. Their average agent tenure is 12 years, and a high percentage are certified as world-class FCR performers.
5. How to Measure and Improve FCR Using Customer Service QA Software?
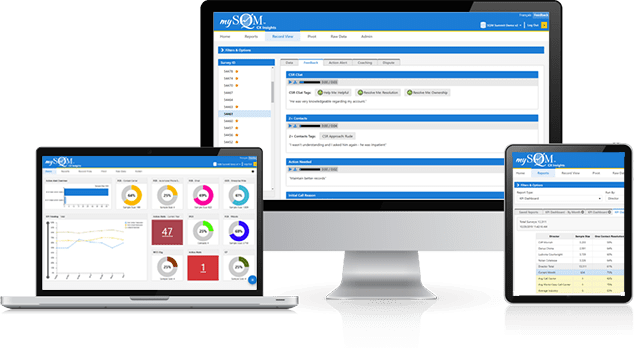
Customer Service QA Software
Measuring First Call Resolution can be complex. Our QA software removes the complexity of measuring FCR and provides an accurate FCR rate. Furthermore, our QA software can measure FCR using multiple methods to calculate the FCR rate. For example, SQM’s Customer Service QA software measures FCR using internal (e.g., case management/CRM) and external (e.g., post-call surveys) methods to calculate the FCR rate.
According to G2 reviews, SQM is a leader in QA software. mySQM Customer Service QA software captures, measures, tracks, and benchmarks FCR to provide call centers and agents accurate insights for improving CX and lowering operating costs.
Leveraging the QA data can help improve your FCR rates and CX in several ways:
- QA data is critical for identifying new insights into customer interactions to increase your FCR rates.
- QA serves as a check to ensure your agents adhere to your FCR best practices.
-
QA data assists call centers, supervisors, and agents in benchmarking FCR, and this performance insight will motivate agents to improve CX.
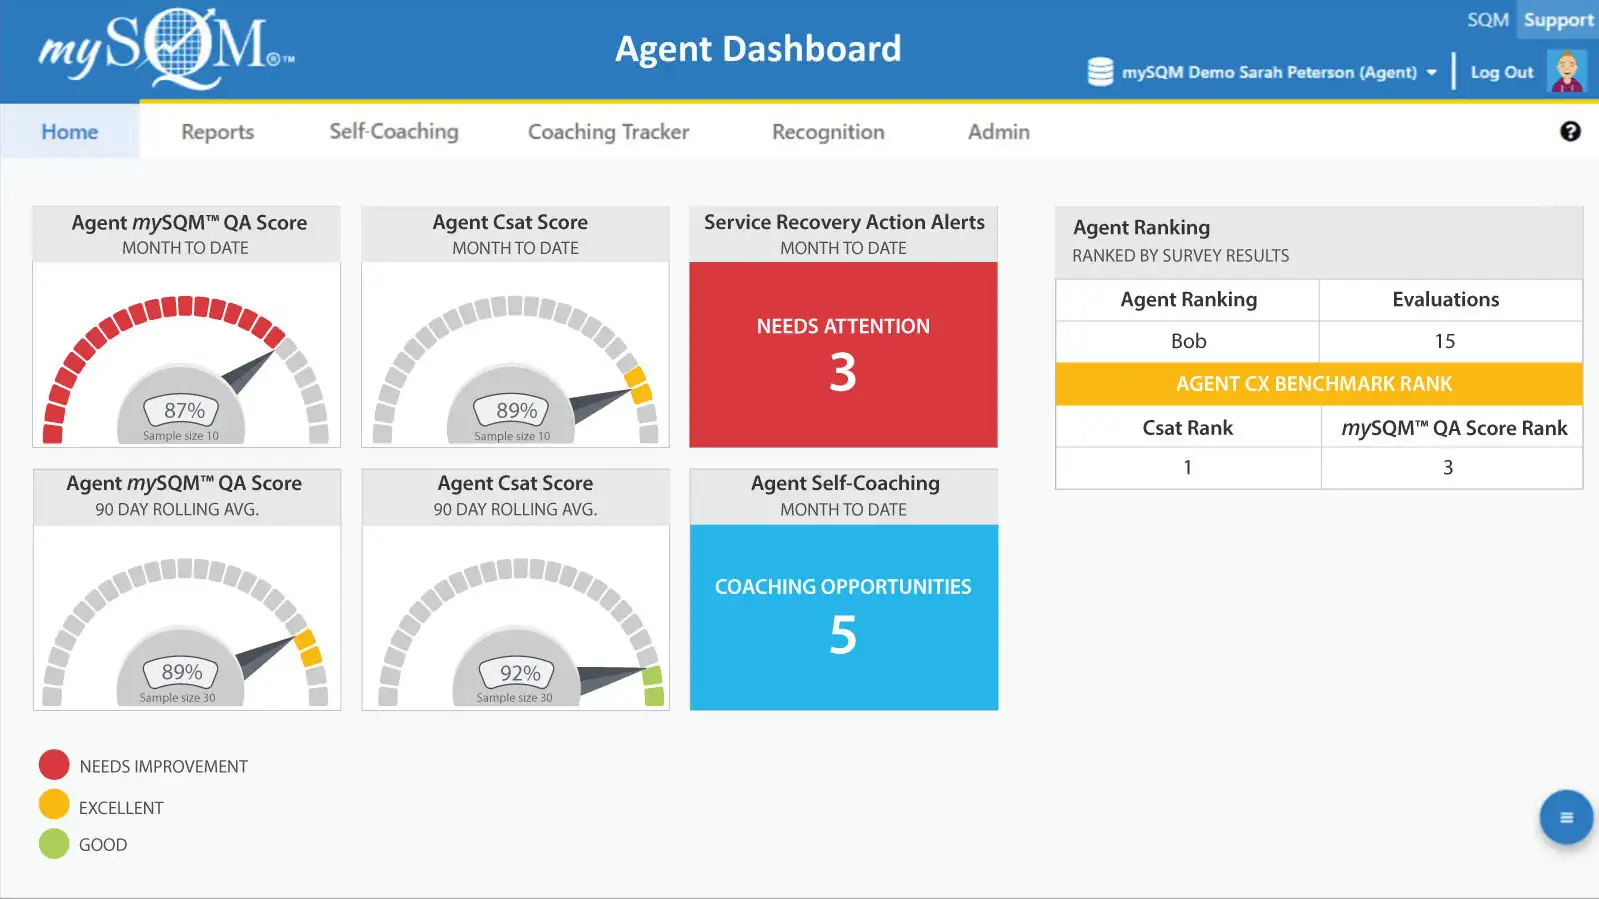
- QA data is used to create an agent dashboard that agents can use to visually view their performance for KPIs such as FCR, CSAT, and CX benchmark rank.
Request a mySQM™ Customer Service QA Demo Video
Learn about SQM's agent… CSAT prediction model, which is based on standardized metrics, AI, and regression analysis to predict customer satisfaction derived from a QA evaluation. Our CSAT prediction model provides a high statistical correlation, translating to a 95% success rate in predicting agent CSAT in most cases.
4.6
 Stars on G2 for mySQM™ Auto QA Tool Reviews
What Differentiates SQM from its Competitors is our...
mySQM™ Automated QA/CX Analytics Solution that uses proprietary AI technology and intellectual property to determine QA scores and predict customer satisfaction with up to 95% accuracy for every call. SQM's Post-Call Customer Satisfaction Prediction QA Model - Is a Game-Changer!
SQM's QA and CSAT scores can be used to benchmark against 500 enterprise level call centers. Analyze 100% of customer calls with our auto QA/CX solution.
Furthermore, mySQM™ QA/CX provides agents with self-coaching, self-training, and real-time financial recognition features for calls evaluated to help monitor, motivate, and manage agents to deliver great customer satisfaction.

"Resolutionary!"
Verified User in Insurance
(51 - 1000 emp.)

"User-friendly interface, strong service team!"
I've worked with several CX research supplies and would say that the mySQM tool is the best I've worked with so far. Dashboards are easy to setup and customize and it is also quite easy to setup data exports. The team at SQM has been flexible and great to work with.
Verified User in Health and Wellness
(> 1000 emp.)

"Valuable information everyday!"
The widgets are great for quick results and knowing how to start your day with your team. We can see the feedback and hear the input of our customers. The reporting can break down by different levels and metrics. Great way to benchmark your performance and see trends and opportunities.
Verified User in Healthcare
(51 - 1000 emp.)

First Call Resolution Learning Options
Want to learn more about FCR without reading this blog? Click on the FCR video or FCR PPT to learn more about defining, benefits, measuring, and tips for improving the FCR rate.
First Call Resolution - Video
Below is our First Call Resolution Video that covers the definition, benefits, measurement, and tips for improving the FCR rate.

First Call Resolution - Powerpoint Slides
Download our First Call Resolution PPT slides that cover the definition, its benefits, measuring it, and tips for improving it.
Request a Demo and Improve Your Call Center's FCR
Learn more about mySQM™ Customer Service QA software, find out how SQM can help your call center improve customer service and employee experience, and take advantage of the power of Personalized Intelligence™ to improve your FCR.
Reach out today to book your demo.
This will give advocates the opportunity to self-coach and learn better ways to improve before their coach or supervisor gets to them.