7 Essential Customer Service Metrics to Track and Benchmark
Call center metrics play a vital role in measuring, tracking, and benchmarking customer service performance, as well as in determining goals and identifying strengths to build on and opportunities to improve at the agent, supervisor, and call center levels. Given the hundreds of metrics and the volume of data available to call center managers, it is essential to determine the right customer service metrics and how you measure up to them.
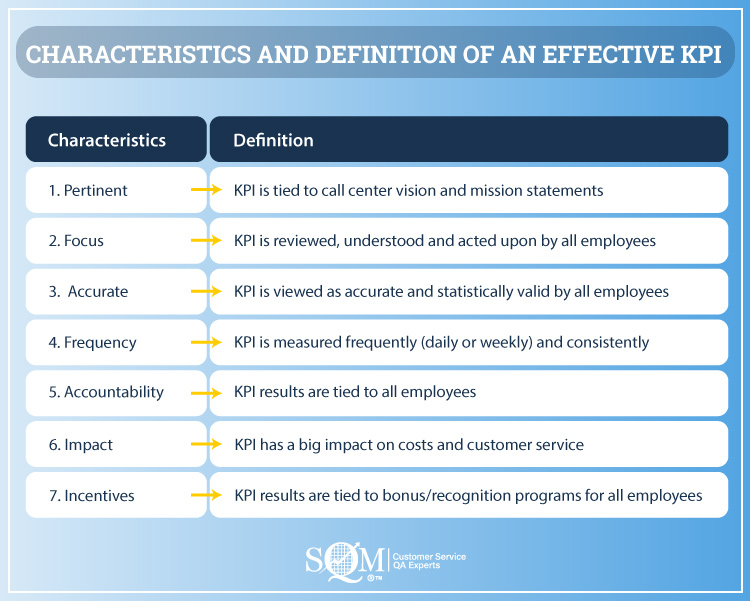
Many call center managers have difficulty determining the right metric to focus on for improving customer service. The below infographic shows the characteristics and definitions of seven effective Key Performance Indicators (KPI) for determining the right customer service metrics to focus performance on. Furthermore, using the seven characteristics and definitions of an effective KPI is a best practice for helping call center managers select the right metrics for efficiently and effectively managing their customer service.
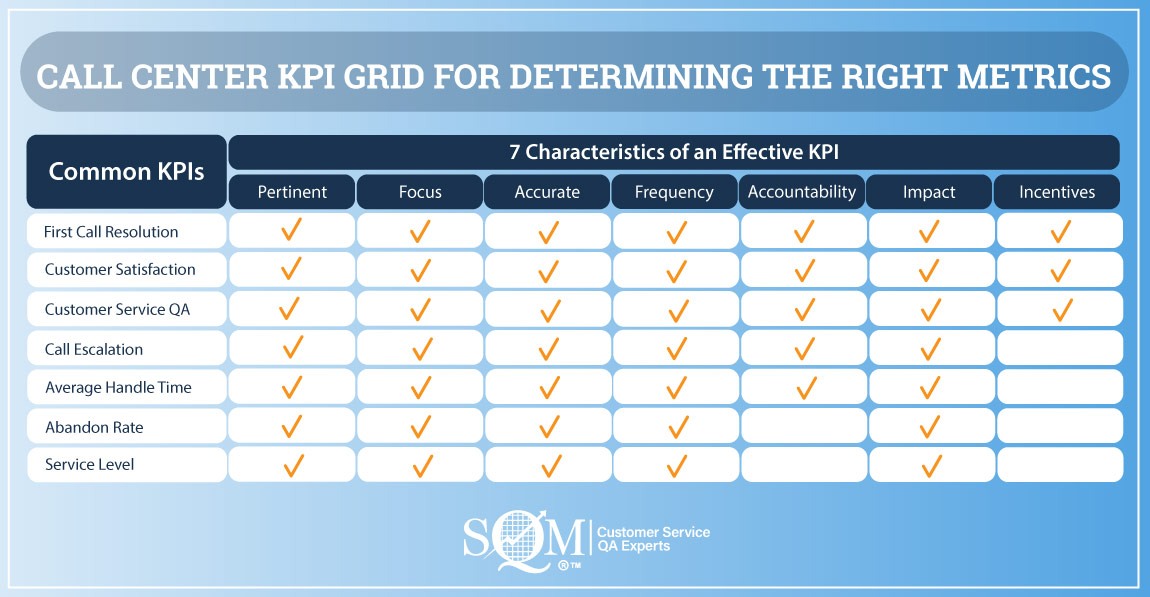
The below grid shows a call center KPI grid used to determine the right metrics to track and benchmark their customer service performance. The more characteristics a KPI meets, the higher impact it has on the customer service of a call center. First Call Resolution (FCR), Customer Satisfaction (Csat), and Customer Service QA are the only metrics that meet the criteria of all seven characteristics of an effective KPI. For this reason, these three metrics are viewed by many call center managers as the most important metrics for determining customer service performance and for delivering insights for improving customer experience (CX).
Every company uses call center metrics to benchmark its success. However, if a call center wishes to achieve great customer service, the following metrics meet all or most of the criteria for an effective KPI. Therefore, you should use them as the primary metrics for managing your call center CX efforts.
Customer Service Metrics
1. First Call Resolution
First Call Resolution is a metric that measures a call center's performance for resolving customer interactions on the first call or contact, eliminating the need for follow-up contacts. The FCR metric is essential for monitoring a call center's operating customer service delivery effectiveness and cost efficiency. As a result, FCR is one of the most-watched call center industry metrics and is considered by many as the most important call center metric. For many call centers, the primary goal is to deliver great customer service cost-effectively. Moreover, SQM's CX research shows that 93% of customers expect their call to be resolved on the first call.
Furthermore, FCR is the KING of all call center metrics because it is a leading predictor for business outcomes due to their CX. Therefore, customers who experience FCR and call resolution are more likely to be very satisfied, continue to do business, and recommend the organization to others due to their call center experience. For example, SQM Group's research has found a 1:1 correlation between FCR and Csat score. That means for every 1% increase in FCR, companies can anticipate a 1% increase in Csat Score.
First Call Resolution Benchmark
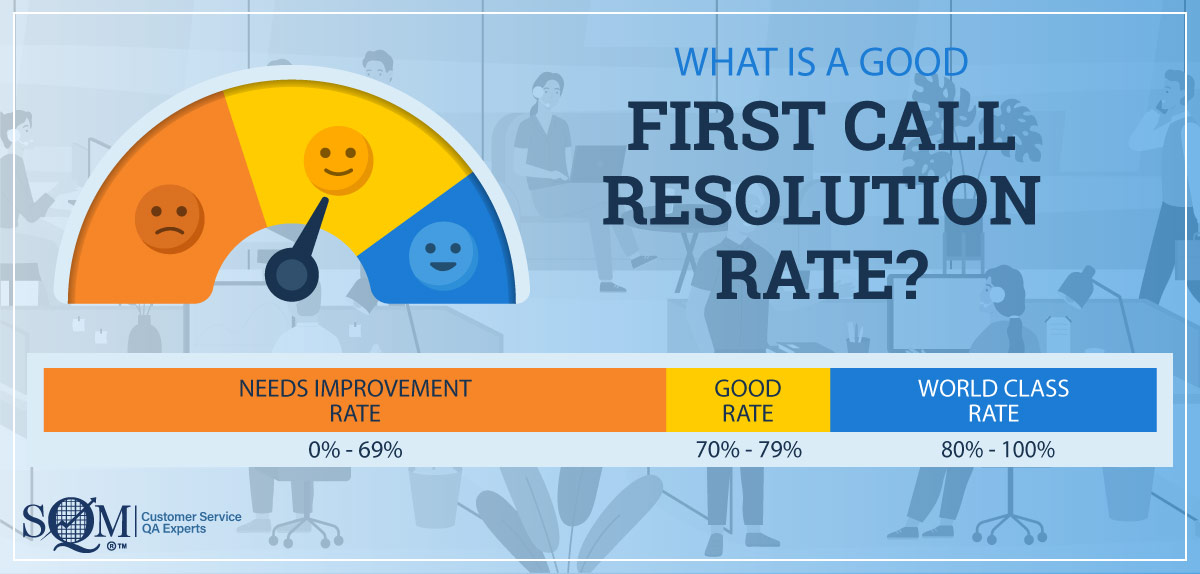
Based on a post-call survey method, the call center industry benchmark average for the First Call Resolution rate is 70%. The FCR rate means that 30% of customers have to call back a company about the same inquiry or problem.
The First Call Resolution industry-standard benchmark for a good FCR rate is 70% to 79%. Therefore, call centers with an FCR rate below 70% need improvement. Conversely, the World-class FCR rate is 80% or higher, and only 5% of call centers can achieve the World-Class FCR Rate.
It is important to emphasize that the FCR rate varies by call centers, call types (e.g., billing, claims, orders, inquiries, technical), lines of business, and industries. Furthermore, the FCR rate can differ by touchpoint (e.g., phone, IVR, email, chat & website).
2. Customer Satisfaction Score
Customer Satisfaction Score metric quantifies how satisfied customers are with their call center experience resolving an inquiry or problem. The call center Csat Score is viewed as one of the most used metrics for tracking, benchmarking, and managing customer service.
Csat Score is based on a post-call phone or email survey conducted within 1 business day of their interaction. The Csat Score scales can vary, but the most common is a five-point customer satisfaction scale (1= Very Satisfied and 5 = Very Dissatisfied). For example, an agent's Csat Score calculation is the total # of very satisfied customers (top box survey response) divided by the total # of customers surveyed.
Moreover, the Csat Score measures satisfaction with the call center's overall customer service and the agent, as well as important moments of truth such as finding the phone number, reaching the right agent, greeting the customer, understanding the reason for the call, helping the customer, caring about the customer, resolving the call, and after-call work.
There is a strong business case for a call center to strive to improve or deliver great customer service. However, accurately understanding that a call center has improved or provided great customer service requires measuring customer satisfaction using a post-call survey method.
Customer Satisfaction Score Benchmark
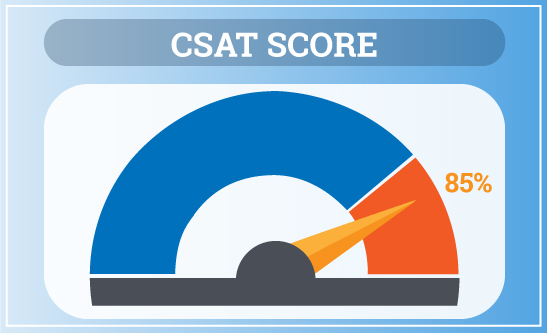
SQM's Csat research shows the call center industry benchmark average Csat (top box response Score is 78%. This means that 78% of customers are very satisfied with the call center's customer service. The call center industry standard for a good Csat Score is 75% to 84%. The World-class Csat Score is 85% or higher, and only 5% of call centers can achieve a World-class Csat Score.
For call centers interested in benchmarking their Csat Score, SQM Group offers a CX Csat Score Benchmarking study that takes 2-3 weeks to complete. The customer survey takes approximately 5 minutes to complete. Customer surveys are conducted using a post-call survey method within 1 day of the call center interaction. SQM benchmarks a call center's Csat delivery against the performance of over 500 leading North American call centers.
3. Customer Service QA
Quality Assurance (QA) refers to the agent and call center support provided to customers before, during, and after they purchase and use a company's products or services. Call centers use their QA program to evaluate performance for the support they provide to their customers.
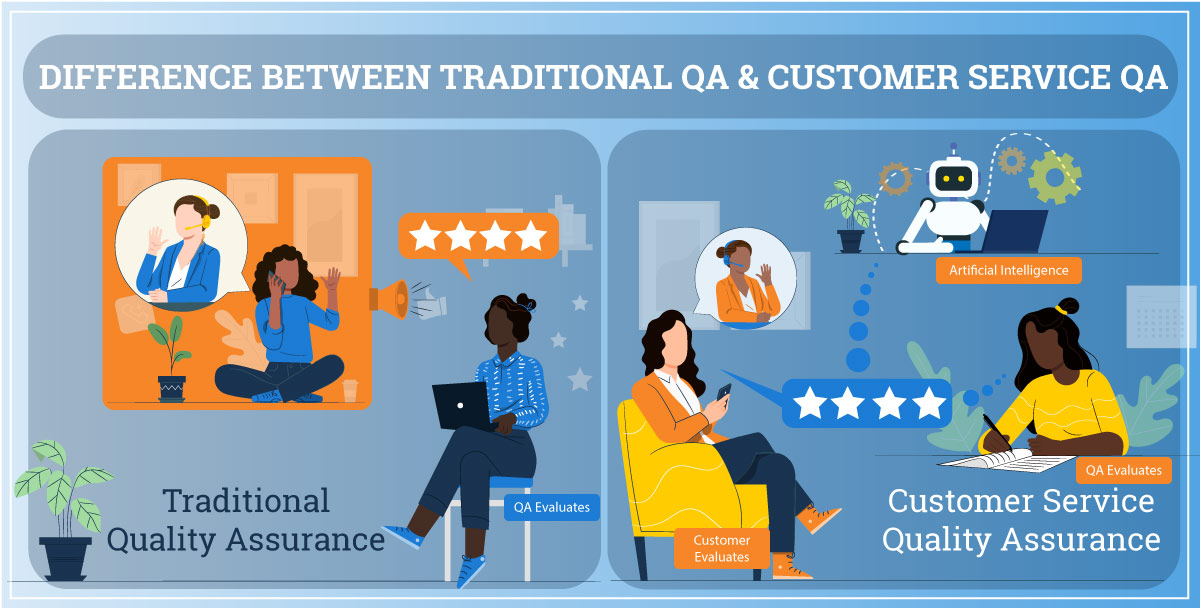
What makes customer service QA unique is for the same call, the customer service QA method evaluates an agent using a post-call customer survey and call compliance metrics to assess call quality. Therefore, customer service QA is considered a holistic view of customer interaction using a call center.
When a call center's primary goal is to improve CX, they tend to be more interested in utilizing a customer service QA method. The main reason is that customer service QA uses a 360-degree multi-rater approach (e.g., customers, QA evaluators, and artificial intelligence) to measure customer service, provide agent feedback and coaching, and has a proven track record for improving CX.
Conversely, in most cases, traditional QA uses only one rater approach to measure and provide agent feedback. In addition, the most effective customer service QA 360-degree feedback approach provides agents with insights based on behaviors they demonstrated on a call that multi-raters could see better than just one rater.
Customer Service QA Benchmark
SQM's Csat research shows the call center industry benchmark average for customer service QA Score is 85%. The call center industry standard for a good QA score is 90% to 99%. A great customer service QA Score is 100%, which means it was a perfect score for CX and call compliance, and only 5% of agents can achieve a great customer service QA Score.
Customer service QA scoring evaluates an agent based on defined customer experience and call compliance metrics, weighting, and standards. It is common for customer service QA scoring to be used for recorded and live calls. QA scoring is used to measure agent performance and coaching and gives them a customer service QA standard goal to strive to obtain.
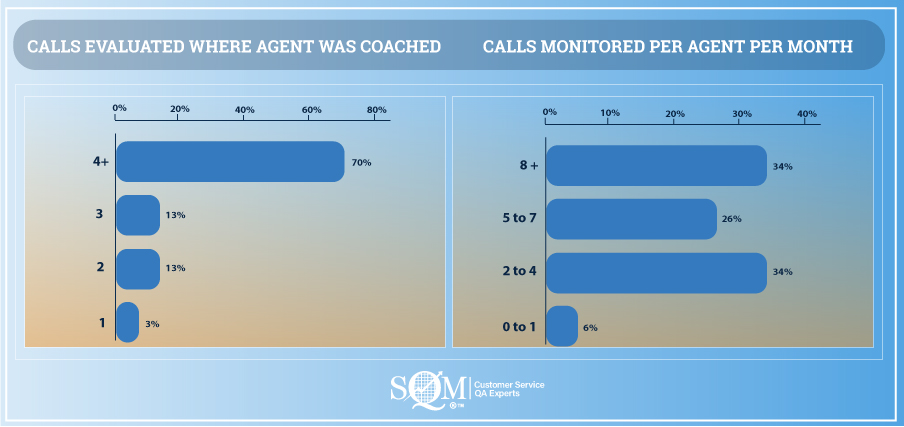
SQM Group's research shows that for the call center industry, calls monitored per agent per month, 60% of call centers evaluate 5 more calls. Furthermore, 71% of call centers say they coach an agent on 4 or more calls that have been QA evaluated.
4. Call Escalation
Call Escalation refers to an escalated call from an agent to a supervisor or agent who handles escalated calls. A call center's escalation support queue's primary purpose is to have those agents working in that queue either assist customer service agents in resolving a call or resolve a complex or a complaint call by taking over the call from the original agent and talking to the customer directly.
The call escalation queue (sometimes referred to as retention, helpdesk, or office of the president) agent support is the last line of defense in many cases for resolving a complex call, supporting a customer service agent, or handling a customer complaint.
Did you know that 14% of customers who use a call center define their call reason as a complaint? In fact, most call centers believe that their customer complaint calls are less than 5%. It is SQM's experience that complaint calls are significantly underreported.
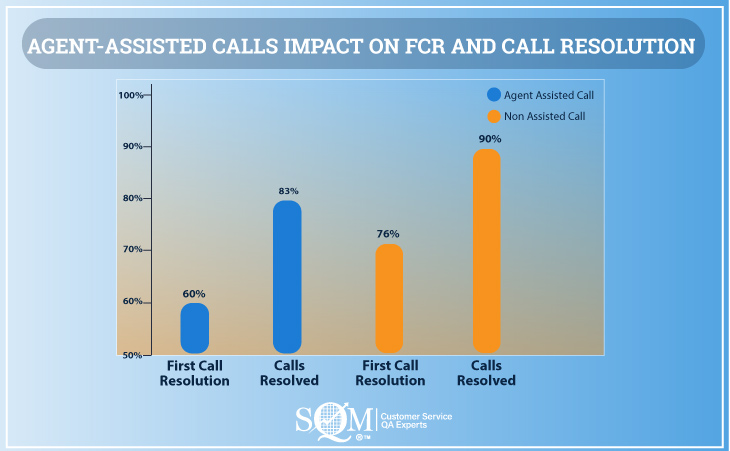
The below figure shows that when an agent needs assistance to resolve a customer's call, the agent-assisted call has a 16% lower FCR and 7% lower call resolution performance. In addition, customer service agents need assistance from another agent, supervisor, or helpdesk agent to help resolve the customer's inquiry or problem on 20% of the calls they handle.
SQM's employee satisfaction research shows that agents are very dissatisfied with the real-time support they receive during a call. As a result, the call center industry needs to improve at providing real-time support for agents.
To improve real-time agent support, call centers need more knowledgeable support employees and support employees available in real-time to help agents resolve the customer's call when they need assistance. The ratio of good support employees (e.g., escalation agents, helpdesk Agents) to customer service agents is 15 to 1.
Call Escalation Benchmark
Given that the call center benchmark industry agent-assisted calls have 16% lower FCR and 7% lower call resolution performance, there is a huge opportunity to improve call escalation. It is common for high-performing customer service call centers where the gap between agent-assisted and non-assisted calls for FCR and call resolution is less than 2%.
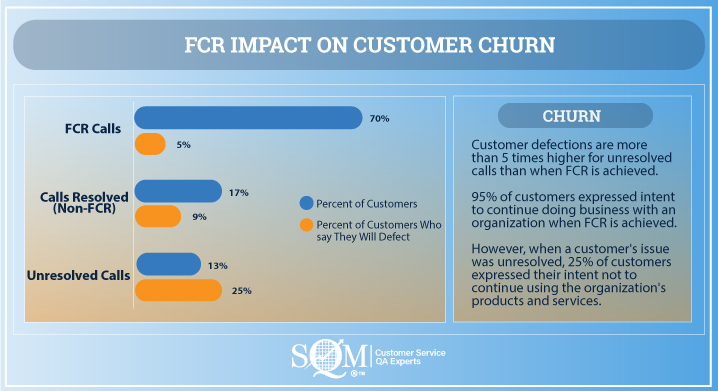
Furthermore, what is essential to understand is customer churn is more than five times higher for unresolved calls than when FCR is achieved. In addition, it is a well-accepted fact that it costs companies at least five times more to attract a new customer than to retain an existing one. Therefore, the value of retaining existing customers over acquiring a new one can't be overstated. By far, the most significant benefit of using helpdesk agents is retaining customers, which is seldom understood or measured.
5. Average Handle Time
Average Handle Time (AHT) is a metric that evaluates the call length, starting from when the agent answers the call until the call is disconnected. Low AHT can mean that agents are more efficient and need fewer agents to handle the call volume. Therefore, AHT is considered a valuable metric for measuring call length efficiency.
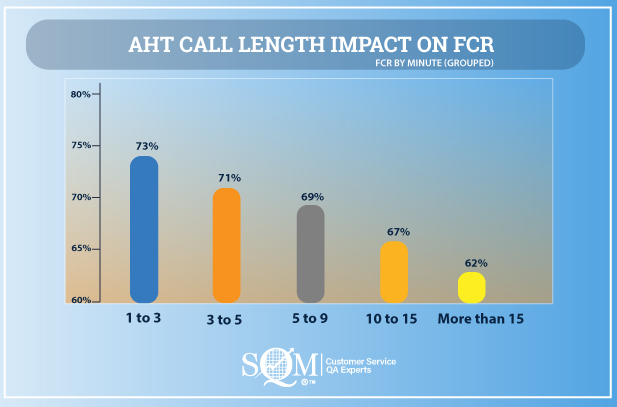
Customers value short calls; however, a lower call length can be misleading because it does not necessarily mean high Csat and FCR. Therefore, it is essential to evaluate AHT and the impact it has on Csat and FCR.
For example, the below figure shows that FCR is significantly lowered the longer the call length. For example, when the call length is 1 to 3 minutes, FCR is 73%, 3 to 5 minutes, FCR is 71%, 5 to 9 minutes, FCR is 69%, 10 to 15 minutes, FCR is 67%, and more than 15 minutes, FCR is 62%.
One of the most helpful business practices for lowering call length is to reduce call complexity. Many SQM clients streamline their business practices through software applications to make it easier for agents to resolve customer calls. Since call centers are handling more complex calls, streamlining processes and software practices is a worthy initiative.
SQM clients who have improved their FCR because of a new software initiative have focused on improving FCR. Call centers are so complex that they require many different software applications to support agents handling calls to provide FCR and a great customer experience. The top three software applications that our clients have focused on for streamlining are unified desktop, customer relationship management, and knowledge management tool.
Average Handle Time Benchmark
The call center industry benchmark average handle time is 7 minutes, but the average AHT (e.g., talk time, hold, and wrap-up) can vary by call type, line of business (LoB), and industry. Most call centers are interested in lowering AHT to reduce cost and, in some cases, to increase it to improve CX, but when the AHT goes up or down, it is critical to evaluate its impact on FCR and Csat.
So what is a good average handle time for a call center to strive to achieve? The short answer is the lower the AHT, the happier your customers will be as long as FCR is achieved. Therefore, a good FCR for a call center is when the AHT is maximized, so that call length no longer hinders or hampers achieving FCR. Put differently, maximizing AHT is when agents use the right amount of time to achieve FCR because they are efficient and effective in the call-handling practices they use to resolve the call.
Before establishing an AHT improvement goal, it would be helpful to analyze your AHT by LoB, call type, and industry.
6. Abandon Rate
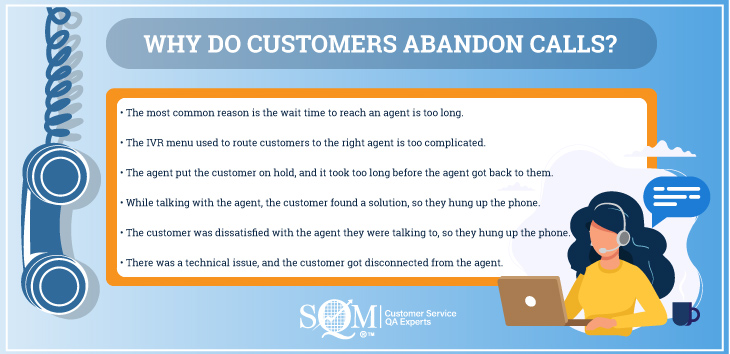
Abandonment Rate metric is defined as the percentage of customers that hang up before they reach an agent. For example, when customers use a call center and are placed on hold after going through the voice menu, many hang up out of frustration before reaching an agent. Therefore, the call abandonment rate is valuable metric call centers use to determine the percentage of abandoned calls.
It is common for call centers to measure call abandonment rates from a holistic approach. For example, it is not uncommon for call centers to measure abandoned calls from abandoned calls while talking with an agent, as well as from customers who hung up before reaching an agent.
Call center abandonment rates can vary by call reason, industry, customer type (e.g., B2B or B2C), line of business, day of the week, and throughout the day. In addition, call abandon rates can be impacted by call-answering goals, strategies, service level performance, agent skills, and staffing.
Abandon Rate Benchmark
The benchmark average for the call center industry for call abandon rate is 6%. Generally speaking, call center abandonment rates of less than 5% are considered good. Sometimes, it is acceptable if the rate is between 5% and 10%. However, if the rate is over 5%, in most cases is viewed as too high. The call abandonment rates can vary depending on the industry, call reason, line of business, time of day, and day of the week. Furthermore, most call centers with great Csat have a 3% or less call abandon rate.
It is essential to mention that false call abandonment rates happen within the first 10 seconds of a call and represent up to 2% of call volume. Therefore, for accuracy and benchmarking purposes, the call abandon rate calculation should include calls abandoned within the first 5 or 10 seconds criteria.
7. Service Level
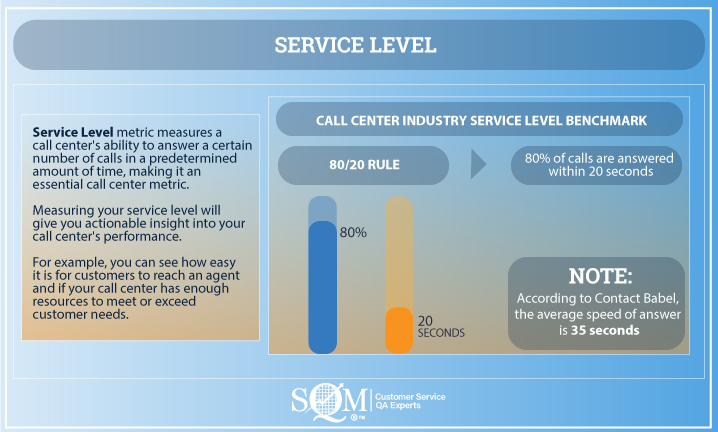
Service Level metric measures a call center's ability to answer a certain number of calls in a predetermined amount of time, making it an essential call center metric. Measuring your service level will give you actionable insight into your call center's performance. For example, you can see how easy it is for customers to reach an agent and if your call center has enough resources to meet or exceed customer needs.
Some managers view service level as a proxy for determining whether the call center delivers good customer service. The problem with that viewpoint is being able to reach an agent quickly is something that a customer values, but just because one moment of truth (MoT) is good does not mean that the other MoTs are good.
A caller reaching an agent easily is viewed as necessary, but other MoTs are more critical, like resolving the call reason. Reaching an agent quickly is a core customer service expectation that does not give you a higher Csat score, but if you make it difficult to reach an agent, it will provide you with a lower Csat score. Therefore, service level should not be viewed as a proxy for good customer service but as part of the customer interaction that needs to be delivered.
Service Level Benchmark
Traditionally the call center industry service level benchmark that most managers aim for is an 80/20 rule, where 80% of calls are answered within 20 seconds. In addition, according to Contact Babel, the average speed of answer is 35 seconds. Many call centers are unsure if their customers can withstand going from 80/20 to 80/60 or longer service level standards. If you are considering going to a different service level target, use Csat Score to see what kind of a difference it makes for your call center.
SQM research shows in most cases that, there is no Csat penalty for calls answered within 120 seconds. Put differently, if a customer's call is answered by an agent between 1 and 120 seconds, there is no positive or negative impact on Csat. Therefore, from a CX perspective, the standard for service level should be the percentage of calls answered within 120 seconds.
Quick Related Links
First Call Resolution Comprehensive Guide Customer Satisfaction Comprehensive Guide Top 10 Call Center Metrics Customer Service QA Good to Great Customer Service