Call Center FCR Benchmarking Results for 2021
SQM Group has been measuring, benchmarking, tracking, and helping leading North American call center's improve First Call Resolution (FCR) and Customer Experience (CX) for over 25 years. In this blog, we share our Call Center Industry FCR Benchmarking High-Level Results for 2021.
We benchmark the FCR rate with over 500 leading North American call centers annually using a Voice of the Customer (VoC) measuring and benchmarking approach.

Our FCR benchmarking research findings are based on conducting telephone FCR post-contact transactional surveys using SQM's in-house telephone survey agents. They called customers within one business day of their call to a call center.
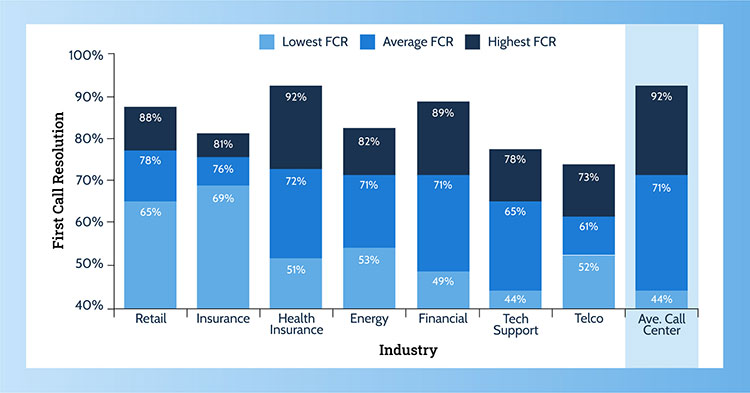
Figure 1 shows the FCR comparison by industry. SQM's research shows there is significant variation in FCR performance by the industry and within each industry. The FCR performance range for the overall call center industry is between 44% and 92%, with 71% being the benchmark average. The 71% FCR rate means 29% of customers have to call back to resolve their call.
The First Call Resolution metric should be considered a balanced scorecard metric because it measures efficiency and effectiveness. For example, SQM Group's research shows for a "1% improvement in FCR, you reduce operating cost by 1%", and for "every 1% improvement in FCR, there is a 1% improvement in customer satisfaction." As a result, the First Call Resolution and customer satisfaction connection are among the highest correlations of call center KPIs.
For the specific industry averages, the retail industry has the highest performance for FCR at 78%, insurance at 76%, health insurance at 72%, financial at 71%, energy at 71%, tech support at 65%, and telco with the lowest FCR at 61%.
Interestingly, for insurance and health insurance industries, call complexity tends to be moderate to high. It is essential to mention that it is not uncommon for insurance and health insurance call centers to perform at the world-class FCR level, even though they have moderate to high call complexity. The bottom line is that call complexity should not be used as an excuse for not achieving world-class FCR performance. At SQM, we consider 80% or higher VoC FCR to be a world-class standard.
Figure 1: FCR Benchmarking Rate Comparison by Industry
FCR Performance Comparison by Call Type
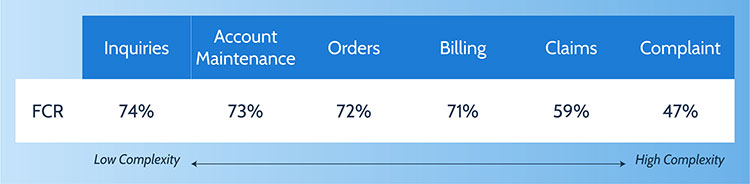
Figure 2 shows FCR performance comparison by call type. The data shows orders with the highest FCR at 75%, inquiries at 74%, account maintenance at 71%, billing at 68%, technical at 63%, claims at 60%, and complaints with the lowest FCR at 47%.
For many call centers, inquiries, account maintenance, and orders have low to moderate call type complexity and, therefore, have higher than average FCR performance. Conversely, billing, claims, and complaint call types have moderate to high call complexity and, therefore, have lower than average FCR performance. We also want to emphasize that we have call centers that are able to achieve world-class FCR standards for all call types with the exception of complaint calls.
As a general rule of thumb, SQM uses AHT (talk and wrap-up time), new hire and existing CSR training, call flow, and desktop applications to determine call complexity. Another essential component of call complexity is the emotional aspect of the call, especially for customers who are calling the call center with a complaint.
Figure 2: FCR Performance Comparison by Call Type
Repeat Calls Impact on Call Center Csat
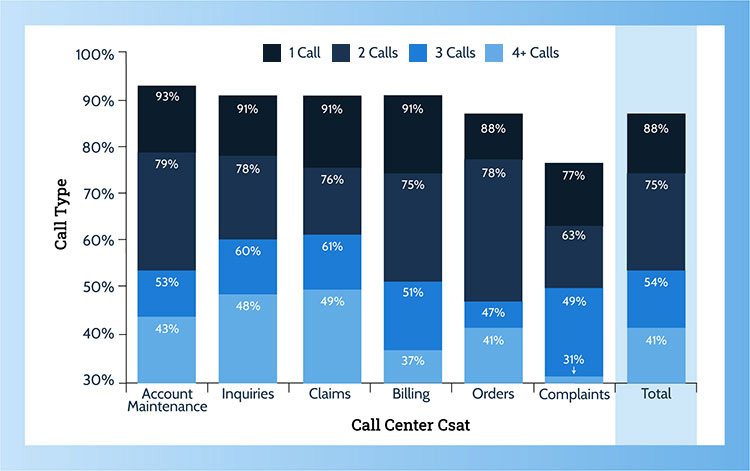
Repeat calls significantly impact a call center's operating costs and Customer Satisfaction (Csat). Figure 3 shows the impact on call center Csat based on the number of calls to resolve the customer's issue for all major call types. Overall, there is a 47% difference between Csat (top box response) with the call center when the call is resolved in one call compared to taking four or more calls to resolve the customer's issue.
On average, for the call center industry, there is a 16% drop in Csat for each additional call required to resolve a customer's call. The Csat penalty for more than one call to resolve the customer's inquiry or problem is similar to most major call types. In other words, if the call has high complexity (e.g., claims and complaints) or has low complexity (e.g., orders and inquiries), the Csat penalty for the number of calls placed remains relatively the same.
Figure 3: Repeat Calls Impact on Call Center Csat
Ranking of the Most Helpful Business Practices for Improving FCR
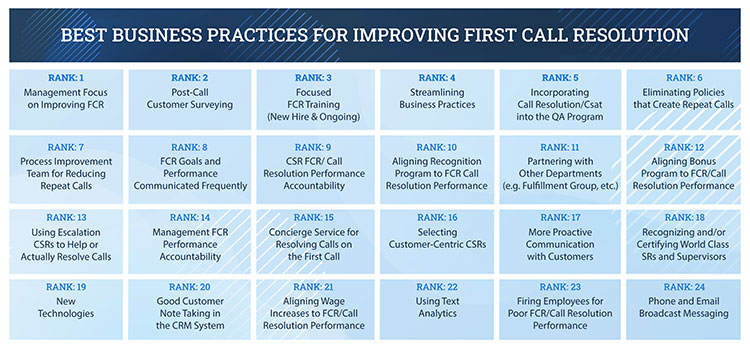
SQM agrees that any of the business practices in Figure 4 can improve FCR and CX performance. According to our clients, the top five business practices for improving FCR are:
- Management focuses on improving FCR
- Post-call customer surveying
- Focused FCR training (new hire & ongoing)
- Streamlining business practices
- Incorporating call resolution/Csat into a QA program
Figure 4: Ranking of the Most Helpful Business Practices for Improving FCR
Quick Related Links
First Call Resolution Definition First Call Resolution PPT First Call Resolution Benefits
First Call Resolution Strategies First Call Resolution Operating Philosophy FCR Case Study Survey Data Calculate First Call Resolution Rate VoC Closed-Loop Top 10 CX Metrics Outside-In or Inside-Out CX Journey Mapping