What Is Quadrant Map Data Visualization?
A quadrant map is a data visualization for a scatterplot that can show key performance indicators (KPIs), such as plotting an efficiency metric on the vertical access and an effectiveness metric on horizontal access, to determine agent performance (see the below figure for illustration). The term “quadrant map” comes from the two-by-two matrix used in conjunction with scatterplot data.
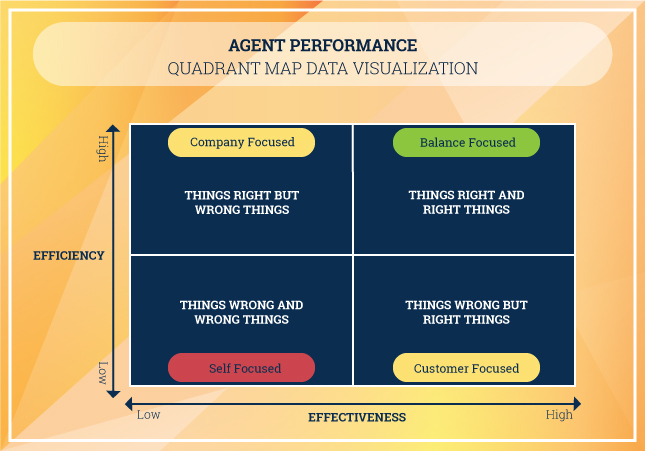
Peter Drucker, a famous management thought leader, said, “Efficiency is doing things right, and Effectiveness is doing the right things.” The below agent performance quadrant map data visualization shows the vertical access efficiency range (i.e., high to low) and the horizontal access effectiveness range (i.e., high to low). Each quad box shows agent performance for KPI efficiency and effectiveness. For example, agent performance quadrant map data visualization shows:
Balanced-focused = Agent is doing things the right way and doing the right things
Customer-focused = Agent is doing things the wrong way but doing the right things
Company-focused = Agent is doing things the right way but doing the wrong things
Self-focused = Agent is doing things the wrong way and doing the wrong things
A common question that we get asked at SQM is: "Can an agent achieve efficiency and effectiveness for KPIs?" The short answer is yes; an agent can achieve efficiency and effectiveness for KPIs. However, in most cases, it is common for only 25% or less of the agents to be able to achieve a balanced focus for achieving high efficiency and effectiveness success by doing things right and right things.
However, improving agent performance in the call center can be complex. As a result, you can argue that supervisors and managers face a challenging and uphill battle for improving agent performance. However, most managers know that the best way to ensure high agent performance is to measure, benchmark, develop and implement improvement action plans.
So how do call center managers know if their agent's performance is at peak performance for efficiency and effectiveness? For many managers, it’s tempting to believe that their agents are at a peak performance level, but what is the best way to measure and validate it? This is where using a quadrant map data visualization is a helpful tool to measure agent performance for efficiency and effectiveness. Before we share insights into the four quadrants of efficiency and effectiveness, we thought it would be beneficial to share common issues for analyzing agent performance.
Common mistakes for measuring agent performance:
1. Analyzing the wrong KPIs: In most cases, the quality assurance (QA) score has low or no impact on positively impacting the customer satisfaction score, which is also an effectiveness KPI. In addition, the KPIs used to determine the QA score are the problem in most cases. Also, most call center managers use multiple KPIs to evaluate agents, but few use a quad map data visualization with efficiency and effectiveness KPIs to measure agent performance.
2. Analyzing data in silos: In many cases, call center supervisors analyze the agent performance one KPI (e.g., AHT, QA, Csat) at a time. However, the one KPI at a time analysis does not ensure a holistic view of an agent’s performance and can lead to poor decisions. For example, suppose an agent has a low average handle time (e.g., an indicator of high efficiency). In that case, it does not necessarily mean they are a peak performer, especially if their Csat is low (e.g., an indicator of low effectiveness).
3. Not analyzing multiple KPIs: In many cases, business decisions are made without taking a holistic approach to analyzing agent performance. It is helpful to use efficiency metrics (e.g., AHT, hold, and transfer rate) and effectiveness metrics (e.g., Csat, FCR, QA) to get a holistic view of agent performance and make informed business decisions.
What is call center agent efficiency?
Efficiency metrics help call center managers and supervisors measure, track, and benchmark an agent's efficiency at doing things right. In addition, efficiency metrics help identify areas to improve agent productivity performance. Therefore, focusing on the right efficiency KPI metrics is essential. So, here are five common KPIs to assess an agent’s efficiency performance and to use on the vertical access on the quadrant map:
- Average Handle Time
- Agent Utilization Rate
- Cost-per-call
- Average Hold time
- Average Call Transfer Rate
What is call center agent effectiveness?
Effectiveness metrics help call center managers and supervisors measure, track, and benchmark an agent's effectiveness at doing the right things. In addition, effectiveness metrics help identify areas to improve agent CX outcomes performance. Therefore, focusing on the right efficiency KPI metrics is also essential. So, here are five common KPIs to assess an agent’s effectiveness performance and to use on the horizontal access on the quadrant map:
4 Quadrants of Efficiency and Effectiveness
Evaluating your call center agent’s performance needs to be an ongoing endeavor. By measuring agent performance for efficiency and effectiveness using a quadrant map for data visualization, call center managers and supervisors can determine the success of agents doing things right and the right things. Of course, where an agent ends up on a quad map depends on wheather you compare them to their team, call center, or industry. So let’s look at the matrix for the four quadrants:
1. High effectiveness and high efficiency.
This quad box is the holy grail for a call center agent demonstrating tremendous value to the company because they effectively and efficiently handle customer calls. When agents deliver efficiency and effectiveness, they maximize their value to the company by lowering cost-per-call, reducing operating costs, enhancing brand reputation, and helping retain customers. The goal of call centers should be to have as many agents in this quadrant as possible. It is essential to recognize these peak agent performers; otherwise, they might lose their motivation to maintain their high performance. It is common for world-class customer service performing call centers to have 75% or more agents in this quad box. However, in most cases, 25% to 50% of agents are in this quad box.
2. High effectiveness and low efficiency.
This quad box is where a call center agent is within reach for maximizing their value to the company by delivering on their effectiveness KPIs performance. But the agent needs to improve efficiency KPIs performance. Furthermore, the agent efficiency issues negatively impact cost-per-call and operating costs, but on the other hand, they have contributed positively in a meaningful way to delivering high CX. Therefore, it could be argued that agents add more value when they deliver on effectiveness KPIs than It is common for customer-centric call centers to have a high percentage of agents in this quad box. Inefficient agents can be attributed to training, coaching, motivation, and software application issues. Also, agents in this quad box can be due to handling more complex calls. In most cases, 25% to 50% of agents are in this quad box.
3. High efficiency and low effectiveness
This quad box is where a call center agent is also within reach to maximize their value but needs to improve effectiveness versus efficiency KPIs. When agents deliver high efficiency, there are offering value immediately. However, many call centers emphasize agent efficiency KPIs because of the short-term cost-per-call and operating cost savings. In addition, many call centers value cost savings more than delivering effectiveness KPIs such as FCR, Csat, QA, NPS, and complaint calls. Therefore, it is not uncommon for call centers to have more agents in this quad box than any other quad box. Agents that are ineffective for KPIs (e.g., Csat, FCR, QA) can also be attributed to training, coaching, motivation, and software application issues. In addition, a high concentration of agents in this quad box might indicate that the call center management team is more focused on meeting the company’s financial needs versus the customer’s needs. In most cases, 25% to 50% of agents are in this quad box.
4. Low efficiency and low effectiveness
Yikes, this is the worst quad box for an agent because they have low efficiency and effectiveness. When agents land in this quad box, they tend to have low employee engagement, quiet quitting, and focus on their needs versus the company and customer needs. It is not uncommon for call centers not to know who their worst-performing agents are for the combination of efficiency and effectiveness KPIs. When agents are in this quad box, they need to be put on a personal improvement plan to improve their efficiency and effectiveness deficiencies. Agents in this quad box need to be terminated if they do not improve at an acceptable level. Typically a call center has 10% or less of agents in this quad box.
How To Use the Quadrant Map for Measuring and Improving Agent Performance?
Efficiency and effectiveness KPIs can both have a substantial impact on the call center's performance. For example, when optimizing for effectiveness, focus on improving targeted customer service opportunities (e.g., call types, repeat call reason), and for optimizing efficiency, focus on scale volume opportunities (e.g., policies, procedures, process, technology).
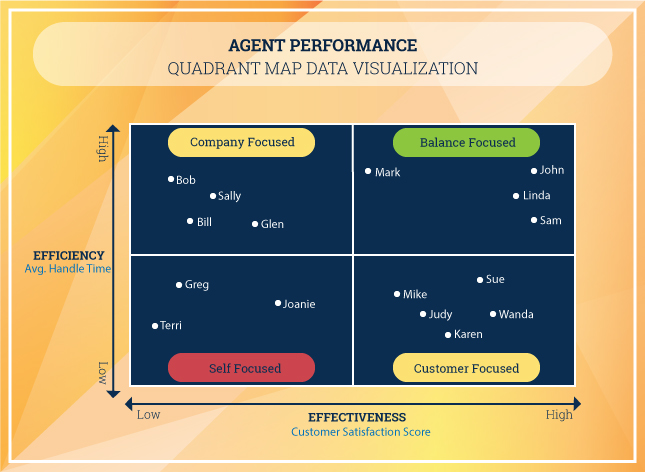
Most call centers have limited resources to improve customer service, call handling, and cost; therefore, they can be torn over whether to focus on efficiency or effective KPIs improvement opportunities. To understand the effectiveness and efficiency improvement opportunities at a supervisor team level, plot agents in the quad map for an efficiency KPI (e.g., average handle time) and an effectiveness KPI (e.g., Csat score).
AHT and Csat are the most common KPIs used for quadrant map data visualization. The below quad map is a typical illustration of a scatterplot of agents for a supervisors' team. The decision that a supervisor will need to make is which opportunities they want to address. For example, does the supervisor want to have action strategies for each quadrant box (i.e., company, balance, customer & self) focused opportunities, or do they want to address a specific quad box (e.g., self-focused) opportunity?
If possible, addressing each quadrant box with specific action plans is the ideal approach. However, if this approach is not viable, use your call center goals as a guide to determine how you want to action the quad map insights. For example, if improving operating costs is the call center’s primary goal, you can target self and customer-focused agents when developing an action plan for efficiency KPI (e.g., AHT) improvement opportunities. On the other hand, if improving CX is the primary goal, you can target self and company-focused agents when developing an action plan for effective KPI (e.g., Csat) improvement opportunities.
Quick Related Links
First Call Resolution Comprehensive Guide Customer Satisfaction Comprehensive Guide 360-Degree Feedback Customer Service QA Good to Great Customer Service