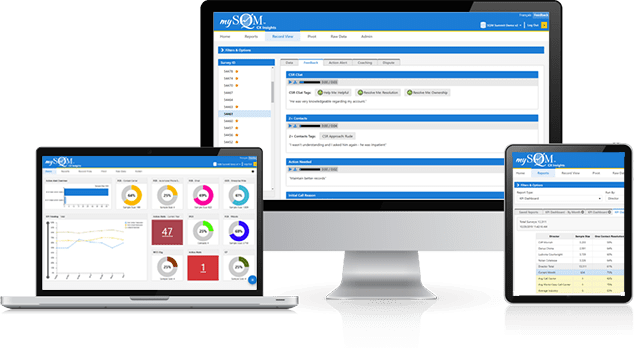
mySQM™ Customer Service QA Software
Explore our 7-day free demo trial! A single platform for call centers to deliver great CX and lower costs. mySQM™ empowers and engages agents with real-time CX feedback, quality assurance, coaching, and recognition to deliver great CX.

360-Degree Feedback
360-degree feedback captures data from multi-raters (e.g., customers, QA evaluators, and artificial intelligence) and stores it in one software platform.
Customer Feedback Loop
The customer feedback loop is a process for identifying areas to improve and implementing new practices that will enhance customer service.
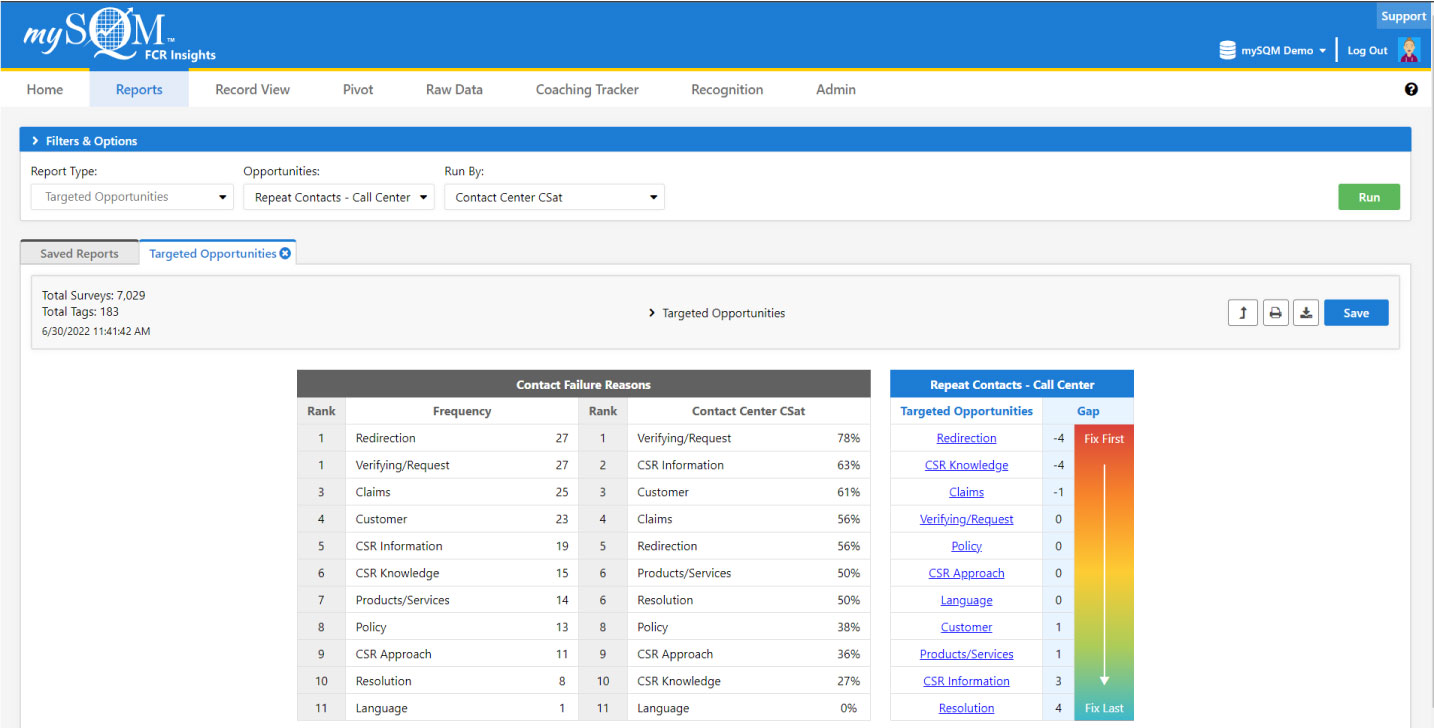
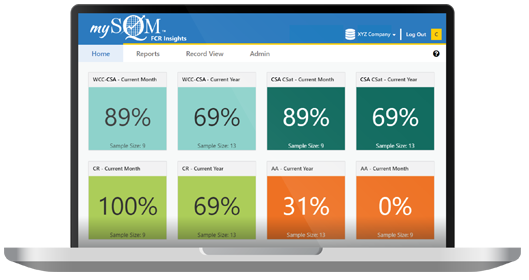
Data Visualization
Great data visualization to quickly understand the graphics and reporting from the agent to the call center level. Powerful widget features.
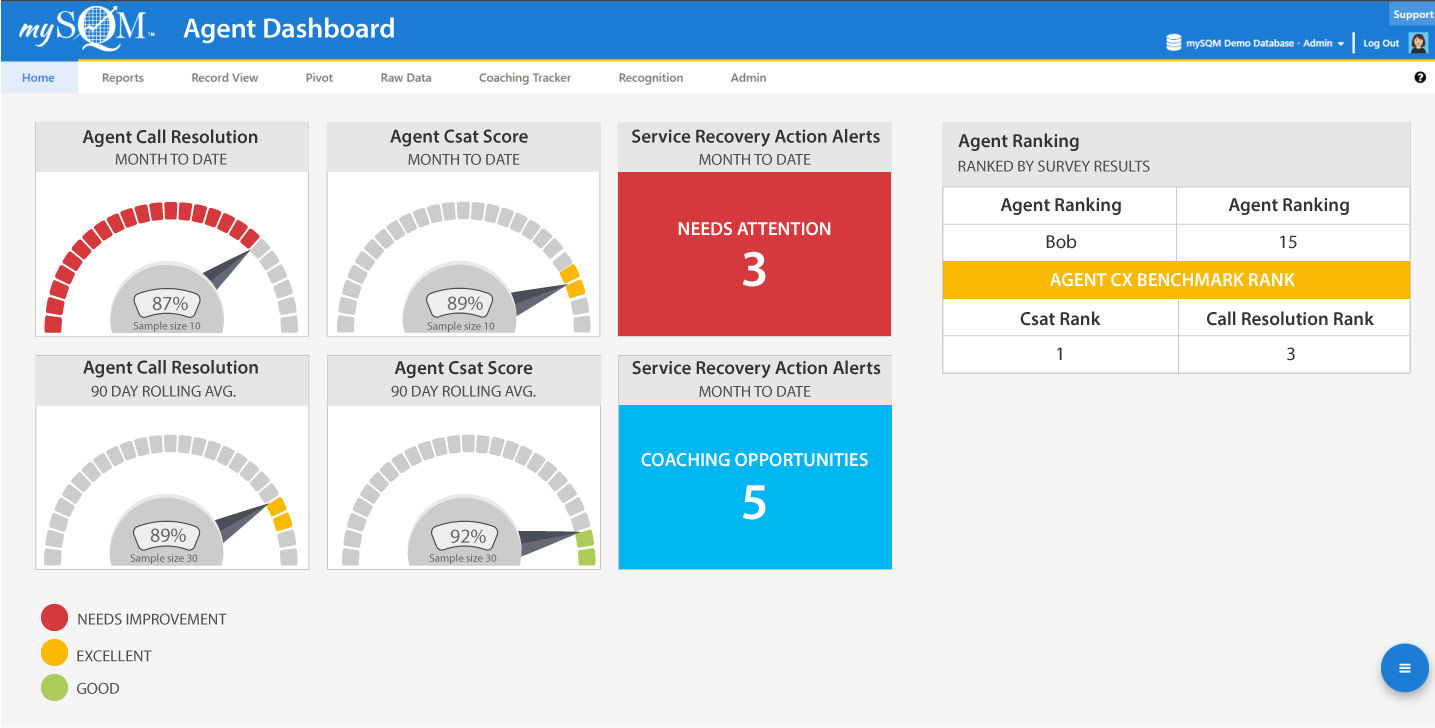
Customizable Dashboard
Our software has a customizable agent dashboard, reports, data filters, access levels, real-time notifications, KPIs, and metrics.

Real-Time Notifications
Pushes real-time notifications about world-class interactions and service recovery opportunities, which can be customized so that you can act quickly to improve FCR and CX.

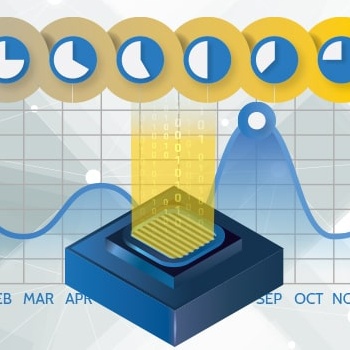
Customer Service Reports
Customer service reports to help discover emerging trends and monitor and optimize CX by providing the right agent coaching and training based on CX tracking and benchmarking report insights.

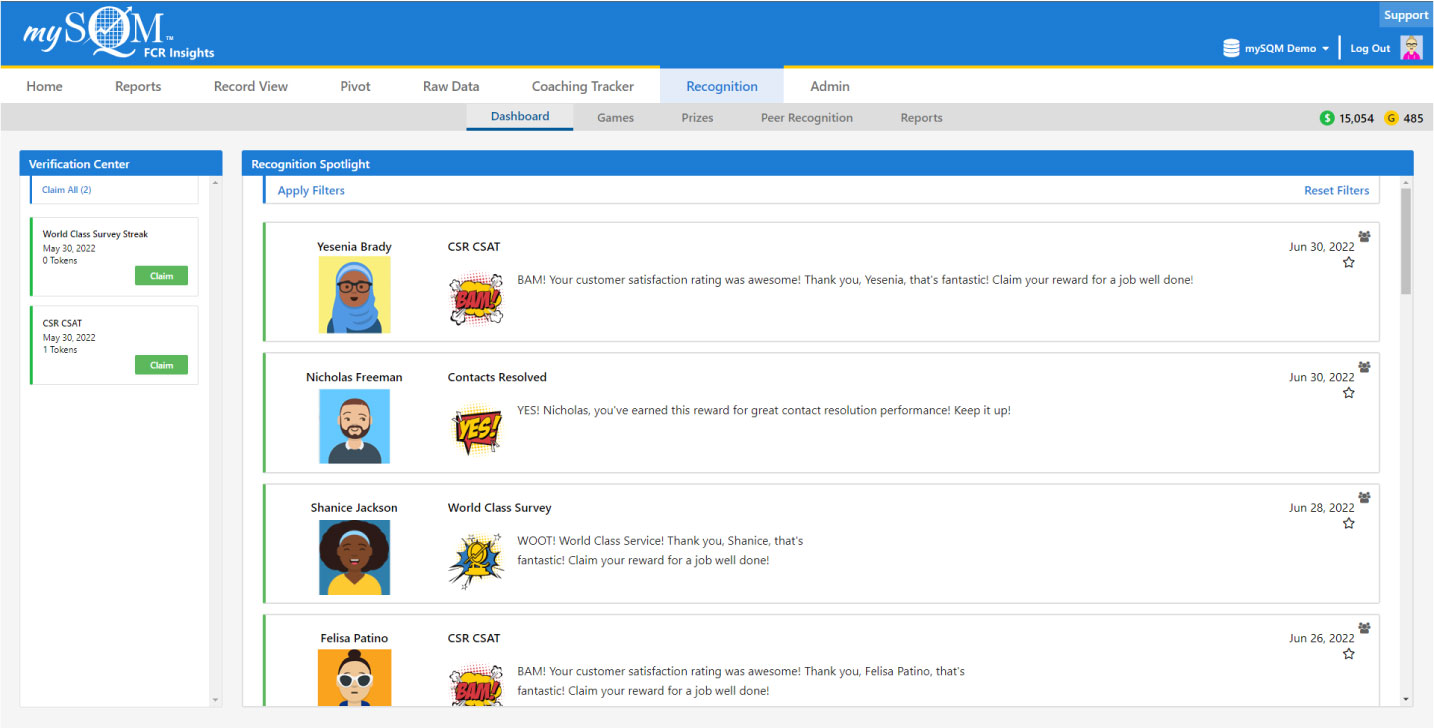
Rewards & Recognition
Award points based on agents VoC performance that is captured in mySQM™ Customer Service QA Software and can be redeemed for cash on an SQM debit card.

CX Essentials Coaching
Our software uses VoC survey feedback to identify customer persona communication style and provide agent CX performance tracking and individualized coaching opportunities.
Benchmarking & Ranking
CX benchmarking and ranking data at the agent level is captured and reported in real-time through mySQM™ Customer Service QA software.

Knowledge Builder
A searchable library of CX Essential soft skills, social styles, and validated best practices from improving and providing great CX.

CX Soft Skills e-Learning
Virtual, on-demand and instructor-lead e-learning for CX soft skills modules delivering through our mySQM™ Customer Service QA Software.

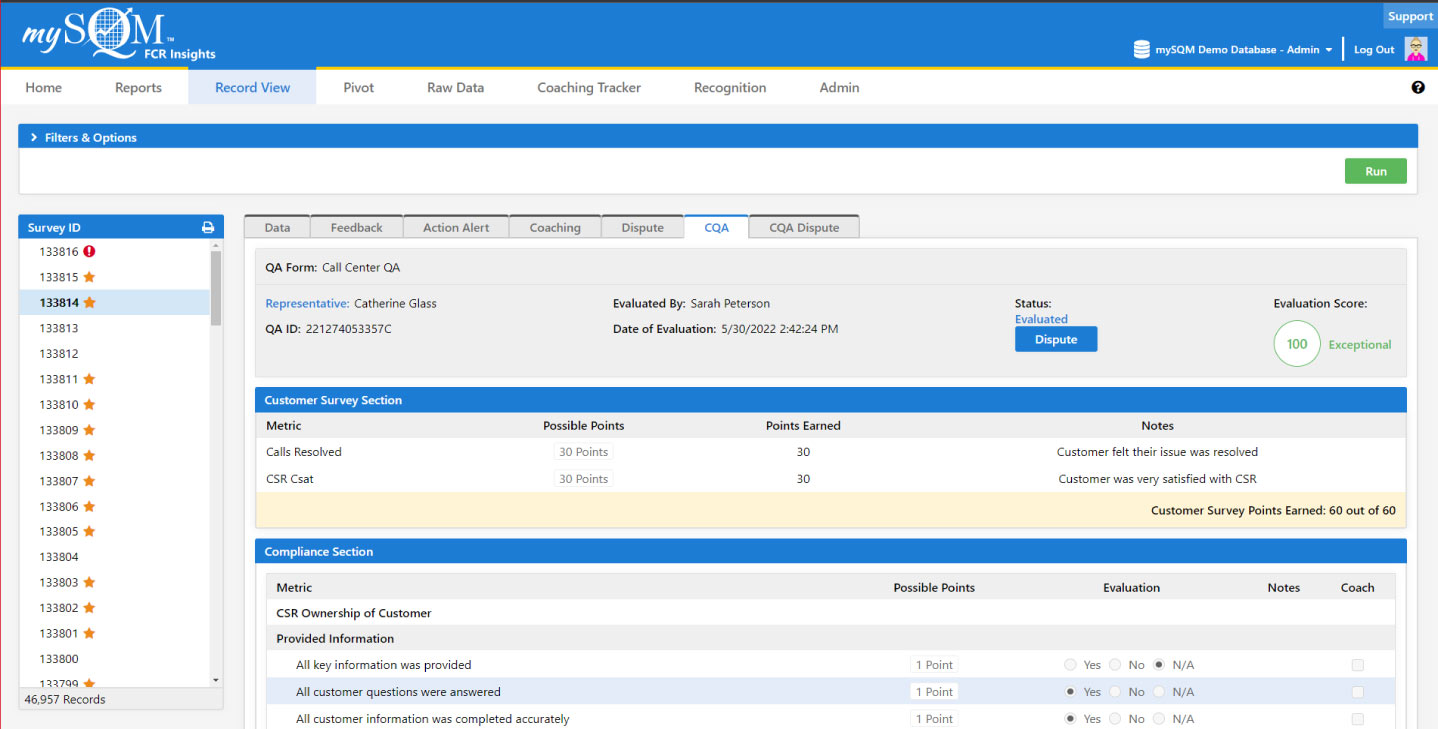
Customer Quality Assurance
A holistic approach to call quality monitoring that uses both the voice of the customer and call compliance information.
mySQM™ Customer Service QA Software Benefits
Reduce Operating Costs
Reduce Customers At Risk of Defection
Improve Customer Satisfaction
Improve Employee Satisfaction
Why Customers Love mySQM™ Software

High quality surveying company.
"The customer service we receive from SQM is at an extremely high level. Very friendly, verify timely responses. And they must be a good company because they have a very low turnover rate. We've been working with the same vendor managers for years now."

User-friendly interface, strong service team.
"I've worked with several CX research suppliers and would say that the mySQM tool is the best I've worked with so far. Dashboards are easy to set up and customize and it is also quite easy to set up data exports. The team at SQM has been flexible and great to work with."

Exceptional service!
"Working with the great folks at SQM I truly feel that they equal my passion and desire to completely satisfy our customers."
Explore our 7-day free demo trial!
See how our customer service QA software platform, built for call center supervisors and agents, effectively monitors and makes it easy to understand performance while reducing the time needed to absorb the data to improve CX.


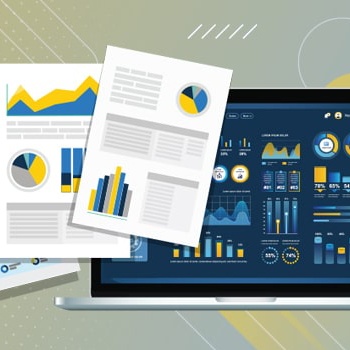
Customer Service Reports
More and more businesses are recognizing the fact that customer satisfaction is one of the key factors in attracting and retaining customers. In the age of social media, businesses simply cannot afford the ire of one dissatisfied customer who can broadcast his or her experience to the world. Thus, many organizations are keen on taking the customer-centric approach.
But how do you gauge your customer service teams’ performance? That’s where customer service reports come in handy.
What Are Customer Service Reports?
Customer service reports will give you a comprehensive overview of how your customer service representatives fare in delivering excellent customer experience. This report will take into account key metrics like customer requests or queries, first call resolution (FCR), response time, average handling time, complaints, and customer feedback.
Why Are Customer Service Reports Important?
Customer service reports give you a robust picture of where your team’s overall performance in handling customer issues and requests. This will provide you with valuable insights into discovering trends and optimizing customer service processes. Furthermore, this report will also help identify areas that the team is doing well and those that need improvement. Having access to this information in real-time helps you provide the right training or coaching to your agents, set realistic goals for your company, and allows you to make data-driven decisions to make your organization more competitive.
Customer Service Reporting Structure: What's Included In the Report?
Every organization is unique in the way it handles customer concerns and in how it’s expected to deliver high customer satisfaction. Thus, customer service reports should include all the key performance indicators (KPIs) that paint an extensive picture of your customer satisfaction goals. These metrics vary for different organizations. But in general, these commonly used KPIs are indicative of your team’s performance:
Customer Satisfaction Score
One of the most used metrics in a customer service operation, the customer satisfaction score (Csat) quantifies how satisfied the customers are with the agents in resolving their issues or handling their requests. This score is often generated using customer surveys or feedback forms.
First Call Resolution Rate
This metric refers to the percentage of customers that have their issues or requests handled satisfactorily upon first contact. A high FCR rate means that there’s no need for the customer to call back or escalate, which translates to a call center’s operating costs efficiency and overall customer satisfaction.
Average Hold Time
This metric is the amount of time the agent places a customer on hold. Nobody likes to wait and though customers might be willing to bide their time just so they can have their issues resolved, a long hold time can have a negative impact on the customer’s experience with your company.
Escalated Calls
Calls often escalate when the customer’s issue is too complex for the first agent to resolve or when customers become dissatisfied or irate with the agent that they ask for a supervisor or manager. The goal is to keep the number of escalated calls to a minimum, and the escalation support team should be the last resort in resolving the issue.
Call Center Performance
Customer satisfaction is not just contingent on the performance of the customer service agents who are on the frontline in handling customers’ queries or problems. Executives and operations managers also have the burden of ensuring that call center performance is up to par with the organization’s goal.
This entails the use of call center reporting tools so you have real-time access to volumes of data that provide a comprehensive picture of how the entire call center operation is performing. With the right call center reporting metrics, executives can gauge the best way forward in terms of workforce management and call center-wide strategies to deliver the best customer service.
Call Center Reporting Best Practices
Here are practical tips for generating effective call center reports that impact the company’s bottom line:
Focus on What Matters
With volumes of data coming your way and different effective strategies pulling you in many directions, it’s vital that you laser-focus on metrics that matter. It’s also important to keep in mind that what’s important for one department may not necessarily be relevant to another department. For instance, schedule adherence and agent occupancy may be important metrics for an operations manager to gauge overall call center performance but they’re not really relevant to customers.
Set Data-Driven Goals
Use call center metrics analytics and reporting features of a customer service software like mySQM™ to set reasonable goals for the team. Take into consideration factors like customer service improvement, workplace satisfaction for the agents, and operating cost reduction.
Put a Premium on Customer Feedback
Customer satisfaction should be front and center for any call center operation. That’s why it’s important to conduct post-call customer surveys. With positive and negative feedback from customers themselves, you have an excellent indicator of your team’s performance.
Make Data Accessible
Call center performance is the sum of each agent’s performance. Thus, it’s only fitting that agents also have access to their performance data. Software like mySQM features a call center agent performance dashboard so that they can benchmark their performance against the average and best performers of the team. Aside from being a nifty tool for coaching, this empowers agents to be more proactive in improving their KPIs.
Customer Service QA Performance
Customer service quality assurance teams monitor agents’ calls to assess compliance with metrics such as:
- Verification procedure
- Information accuracy
- Tone and language
- Adherence to script
- Screen navigation
- Compliance with company policies
All these are well and good but it’s more geared to satisfy the organization. They don’t do much to improve customer satisfaction.
Thus, the traditional QA process is no longer enough in today’s very competitive business landscape. Instead of the usual call compliance process, it’s vital that you measure a customer service QA performance. This metric will not just take into consideration the metrics enumerated above, but it also focuses on customer service enhancement while complying with the conventional QA performance indicators.
How Does This Type of Call Center Monitoring System Work?
Providing a more holistic approach to call assessment, customer service QA (CQA) takes into account not just the organization’s perspective but also the customers’ perspective in determining what makes a call excellent.
Since this metric is a blend of customer and QA support evaluation, the CQA scorecard reflects both the customer survey and call compliance metrics for the same call. Points are then allocated for every metric. Then the points are summed up to get the total CQA score for each agent.
A customer service QA evaluation form would typically include these metrics:
A. Customer Assessment (External Evaluation)
- Customer Satisfaction
- Call Resolution
- Customer Experience
B. Call Compliance (Internal Evaluation by QA staff)
- Information Accuracy
- Call Handling
- Customer Service Quality
- Security
- Selling/Upselling of Products or Services
Benefits of Using Customer Service QA
Here are the advantages of using CQA compared to traditional QA:
Higher FCR
With a QA scorecard that takes into account how the customers feel, agents are more motivated to do their best and resolve customer issues on first contact. This alone has a huge impact on customer satisfaction as customers can sense when agents sincerely try their best to resolve issues and when they just go through the motions to comply with what the company expects of them.
Better Coaching Sessions
Coaching sessions become more productive since the QA scorecard reflects all the metrics that really matter. So the agent and the coach can take a holistic approach to improving overall performance.
Lower Call Center Operating Cost
Research shows that for every 1% FCR improvement, call center operating cost is reduced by 1%. It’s like hitting two birds with one stone: higher FCR reduces costs and improves customer satisfaction.
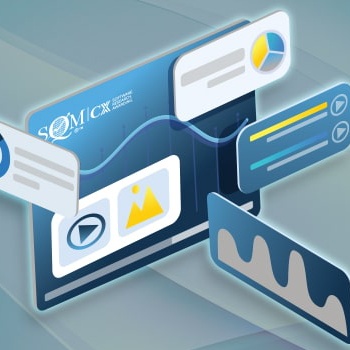
Call Center Reports
Call center reports provide managers with an overview of the call center's efficiency and performance. Here’s a roundup of the different types of call center reports:
Call Abandon Report
This metric shows you the percentage of customers that abandoned their calls and the average amount of time they waited before they dropped the call.
Agent Status Report
This report shows you the name of the agent, their ID number, and their automatic call distribution (ACD) states. ACD states tells you whether the agent is signed out, on a break, idle, busy, on a call, or available. This data is used to calculate agent occupancy and schedule adherence.
Agent Activity Report
This report shows the historical data of the agents' call activities. This includes information like the number of calls handled within a given time frame, the average handle time of those calls, and the shortest or longest call handling time.
Call Transfer Report
This metric gives you insight into the number of inbound, outbound, and internal calls your call center handled in a given time. This data gives you an understanding of the demand and gives you concrete numbers to base your forecasts on.
Inbound Call Summary Report
This data provides statistical insights on all inbound calls on any given time period. Included in the summary are the number of inbound calls, abandoned calls, answered calls, average call handling time, and agent’s speed at resolving issues or answering queries.
Call Detail Report
This report shows you the callers’ details, how long they waited in the queue, the start and end times of the calls, and how long they lasted. This data should give you an idea of the productivity of the call center as a whole and agent-level performance.
Queue Activity Report
This data shows the real-time activity of a particular queue. How long on average callers have to wait, the number of interactions on a queue, and the agents' status on the queue.
Service Level Agreement (SLA) Report
An SLA is an agreement between the call center management and the client in terms of the standard of service expected from the call center. For instance, a client may require that 75% of inbound calls must be answered within 30 seconds or less. This report allows you to monitor call statistics in real-time to make sure you comply with the terms of the agreement as much as possible.
Delivering the best customer service through a call center operation involves crunching a lot of data. Fortunately, customer service QA software like mySQM can help you make sense of these numbers. A quick look into the dashboard and a few clicks of the button convert these raw data into actionable information allowing your business to stay head and shoulders above the others.