Core Features Overview
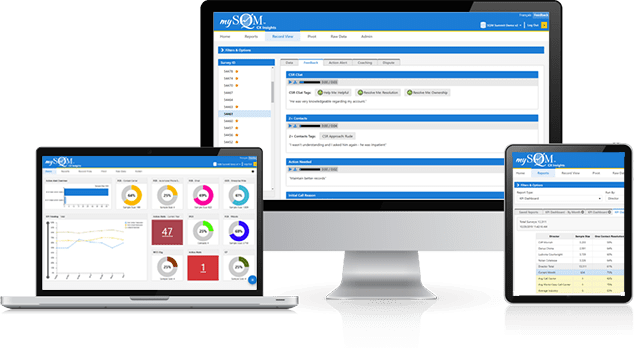
- mySQM™ Automated QA Solution - is a CX and QA management solution designed on a SaaS platform.
- The core features of mySQM™ Auto QA solution are designed to capture, analyze, benchmark, track, and report on CX and QA metrics, manual or automated QA evaluations.
- Furthermore, we offer automated QA to monitor 100% of the calls for CX sentiment performance and call compliance adherence.
- At the heart of mySQM™ Auto QA solution are six core features: auto QA feedback, data analytics, data visualization, highly customizable, providing real-time notifications, and listening to recorded customer feedback.

Auto QA Scoring
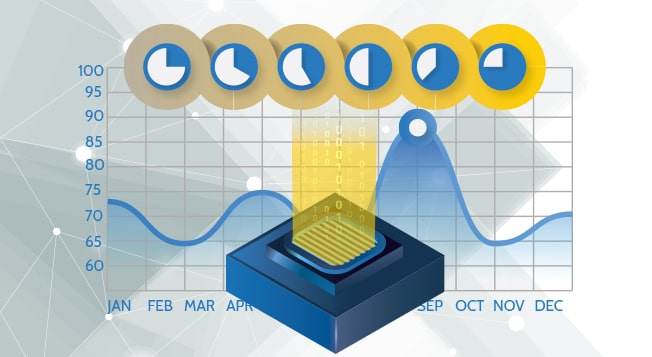
mySQM™ QA uses auto-scoring to determine QA score and call compliance and predict customer satisfaction scores for 100% of evaluated calls. Our 360° Auto QA scoring approach captures and combines three data sources: (1) CX post-call surveys, (2) customer service, and (3) call compliance data-based manual or automated QA evaluations.
All captured data is stored in mySQM™ QA tool, and you receive comprehensive insights into your call center's Total QA Score, Predicted CSat Score, Customer Service, and Call Compliance metrics. In addition, raw data can be easily exported through the scheduled and customizable features of the software.
Data Analytics
mySQM™ Auto QA provides data analytics for assessing performance and identifying KPIs such as Csat, FCR, QA, customer service, call compliance, and cost improvement opportunities from the agent to the call center level. Benchmark and track your KPIs from the agent to the call center level against average and world-class performers.
Preconfigured reports evaluate performance and provide targeted opportunities for Total QA Score, Predicted CSat Score, Customer Service, and Call Compliance metrics. Our advanced pivot table functionality allows customized data analysis to meet your needs. Easily conduct repeat call root cause analysis through our sophisticated repeat call tagging system.

Data Visualization
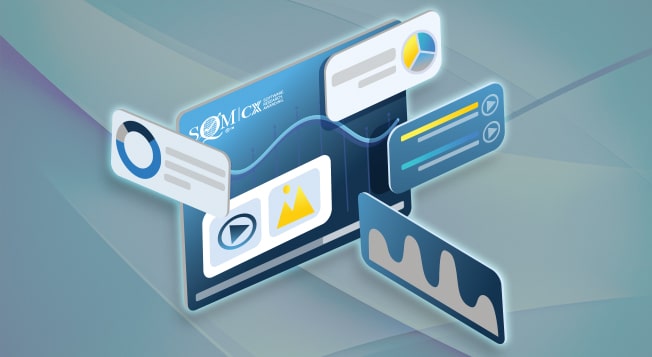
Data visualization for call center automated QA is used to monitor performance trends, identify areas for improvement, and ensure customer satisfaction. mySQM™ QA solution provides comprehensive data visualization for dashboards, QA scores, and scorecards that are easy to understand and, most importantly, to action.
Our data visualizations help stakeholders, such as QA managers, supervisors, agents, and data analysts, gain quick insights into call center performance, allowing for real-time decision-making and process improvements. In addition, data visualization is highly flexible and can be easily customized and saved for reuse.
Highly Customizable
mySQM™ QA solution allows you to easily customize many features, including dashboards, scorecards, reporting, data filters, access levels, real-time notifications, customer service, and call compliance QA metrics.
Highly customizable features allow your employees to focus on what is important to them and your call center. We recommend that call centers use our mySQM™ QA standardized metrics with customizable metrics to meet client needs further.

Real-Time Notifications
Our Auto QA system is programmed to flag interactions that fall below specific quality or compliance thresholds, and the notification summarizes key areas for improvement. This helps managers and agents improve performance proactively.
Real-time notifications can be customized so that you can act quickly to improve customer service and call compliance performance. For example, receive real-time service recovery notifications for poor customer service, call compliance issues, or low QA scores to promptly resolve customer complaints and non-compliance problems. Also, receive real-time notifications about world class CSat interactions and QA scores so you can recognize excellent agent service delivery.

Call Recording
Our Call Recording tool is used in call centers to record and store customer interactions with agents for quality assurance purposes. It allows supervisors, managers, or quality assurance teams to listen to these calls, review them, and assess the agent's performance based on predefined criteria. We can record 100% of the calls.
Listen to the actual voice of the customer's recorded feedback (e.g., surveys, call recordings) from their experience using your call center. Hear the joy or pain in the customer's voice in their interactions with your agent's service delivery and leverage this for powerful coaching and recognition opportunities.
Request a mySQM™ Automated QA Demo Video
Learn about SQM's agent… Csat prediction model, which is based on standardized metrics, AI, and regression analysis to predict customer satisfaction derived from a QA evaluation. Our Csat prediction model provides a high statistical correlation, translating to a 95% success rate in predicting agent Csat in most cases.
mySQM™ Automated QA Solution — Business Case
Learn about the business case for using mySQM™ Automated QA solution to improve your customer experience and operating costs by focusing on first call resolution, call resolution, customer satisfaction, NPS, quality assurance, and other internal metrics at the call center to the agent levels.

For every 1% improvement in FCR, you reduce your operating costs by 1%.

95% of customers will continue to do business with the organization as a result of achieving FCR.
For every 1% improvement in FCR there is a 1% improvement in Csat.

For every 1% improvement in FCR there can be a 1% to 5% improvement in Esat.

When a customer's call is resolved the customer cross-selling acceptance rate increases by up to 20%.
For the average call center, every 1% improvement in FCR increases transactional NPS by 1.4.
Contact Center Auto QA FREE Trial
Sign up to see if your company qualifies for a FREE Contact Center Auto QA Trial (Valued at $75k)