
Regence Blue Cross and Blue Shield Plans (Federal Employee Program) - Customer Journey Mapping Best Practice Case Study
SQM Group Helped Regence Achieve:
The Call Center is Performing at the World-Class Standard for Customer Service
Company Description
Regence serves more than two million members through Regence BlueShield of Idaho, Regence BlueCross BlueShield of Oregon, Regence BlueCross BlueShield of Utah, and Regence BlueShield (select counties in Washington).
Each health plan is a non-profit, independent licensee of the Blue Cross and Blue Shield Association. Regence is part of a family of companies dedicated to transforming health care by delivering innovative products and services that change the way consumers nationwide experience health care.
Regence Blue Cross and Blue Shield Plans (Federal Employee Program) has 59 Customer Service Professionals (CSP) who handle member and provider calls and 10 Claims Experience Advocates (CEA) who receive claim inquiries from CSP and do back-office work.

First Call Resolution and Customer Satisfaction Results
Since 2015, we have steadily improved our First Call Resolution (FCR) rate from 74% to 86% and Customer Satisfaction (Csat – top box survey response) from 84% to 90%. As a result, SQM has certified us as a world-class customer service performing call center. To be certified as a world-class customer service performing call center, the FCR rate must be 80% or greater.
In addition, based on SQM's customer service benchmarking studies for 500 leading North American call centers, our FCR and Csat performance has consistently been at the top 5% level. Moreover, of the 500 call centers' SQM benchmarks, only 5% of their clients perform at the world-class FCR standard of 80% and Csat standard of 85%.
In 2021, our world-class calls increased by 3% compared to 2020. The 2021 customer service improvement is remarkable when you considered in 2020; we were already performing at the world class FCR and Csat levels. The FCR and Csat improvement resulted from our customer journey mapping and ensuing people, process, and technology improvements.

Opportunity Statement
Our member (also known as a customer) journey mapping program is designed to identify opportunities to better serve and change how we work to promote a member-obsessed culture. We assess 6 to 8 member journey maps per year to improve customer service. In addition, we use non-First Call Resolution (FCR) interactions to identify opportunities to improve customer service.
As an example of a member journey that we mapped, our non-FCR analysis identified an opportunity to improve our member-submitted claims process. By identifying the painpoints in the process that drove unnecessary repeat calls, we were able to improve the information gathering process so that claims could be processed on their initial receipt. Utilizing customer journey mapping and incorporating non-FCR into the process ensures we focus on the right areas to improve customer service (e.g., FCR and Csat) and reduce operating costs (e.g., call avoidance) goals.
The journey mapping of the member experiences visually tells us the story (e.g., moments of truth) or persona type experience over time. Furthermore, the member journey mapping helps us discover potential gaps and opportunities for achieving alignment on goals for change.
What is a Customer Journey Map?
A journey map visually tells the story of a customer's experiences or persona over a period of time. Journey maps are valuable for helping discover opportunities and fail points for improving customer service. In addition, journey maps help achieve alignment on goals and required changes.
The essence of the customer experience (CX) journey map is to walk in the member's shoes as they interact with us using our call center. For example, our CX journey map focuses on specific interactions (e.g., medicare certification letter, member-submitted claim) that have been identified as having high non-FCR that need to be improved.
The journey map illustrates and describes the sequential activities or tasks that customers or employees experience when interacting with our call center. Each activity or task is plotted on the journey map on the horizontal axis. Furthermore, the journey map illustrates the customer's emotions associated with each activity or task on the vertical axis.
The journey map illustration for current and future member experience must be understandable to ensure the workgroup responsible for implementing new people, processes, and technology changes know what needs to be done.
How Does the Member Journey Mapping Work?
Our member journey mapping uses a holistic approach for tools, such as mySQM™ Contact Center FCR software, speech analytics, map illustration, and workgroup employees (e.g., leaders, managers, QA, and subject matter experts) to assist us in our journey mapping initiatives.
The starting point of a customer journey mapping initiative is to determine what customer interaction call reason we need to improve CX. To assist us in deciding which journey map we want to work on is based on SQM Group's voice of the customer (VoC) FCR research; it's the most accurate because it is from a customer perspective to determine non-FCR call reasons.
In addition, focusing on VoC non-FCR interactions for a specific call reason ensures that we are working on the areas that our members want us to improve. Furthermore, focusing on non-FCR repeat call reasons allows us to identify root causes that need improvement to increase the FCR rate and Csat rating.
We incorporate the FCR metric in the beginning, during, and after the customer journey mapping initiative. The FCR metric allows us to determine what to work on and provides insights into whether or not we have been successful in our member journey initiatives. Put differently; the FCR metric keeps the journey mapping workgroup focused on improving CX.
To validate that our workgroup journey mapping team will be improving the right failure or opportunity, a collaborative group consisting of leaders, managers, supervisors, and QA auditors will listen to non-FCR calls. The collaborative group assesses together what theme to work on, which is not always the highest repeat call reason frequency, but what is the impact on CX.
The leadership group has the authority on what failure or opportunity to journey map current and future CX. Part of the decision-making process is where they think they can improve CX. We use speech analytics at this phase to help quantify how often that non-FCR call reason frequency occurs and the member experience for a specific interaction.
For example, a member makes their claim but does not understand what they must do or what info to include. So, they call an agent to ask questions, finally send in the form, and it takes a long time to process, so they have to call back to get a status update. So, part of the project is to resolve claims quicker, so the customer doesn't have to call back to check.
Furthermore, after a repeat call reason has been chosen, the journey map group takes over the improvement initiative, bringing in subject matter experts on the topic. The group uses speech analytics to determine a sentiment score for each critical activity or task. Speech analytics is also unbiased in letting us know the scripting and what was said in specific scenarios.
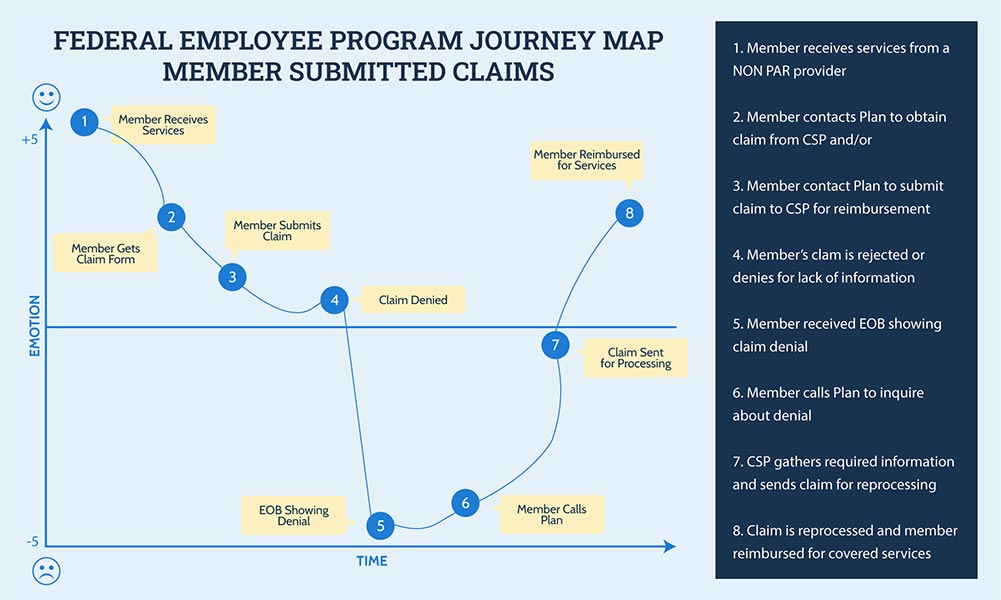
The below journey map shows member-submitted claims opportunity that needs to be fixed. The problem to be fixed was members contact us to submit a claim for a nonparticipating provider, and then the claim is not processed due to missing information. The map shows the positive (e.g., happy face) and negative (e.g., unhappy face) member emotions they experience for each activity or task required (also known as moments of truth) for them to fill out a form and call the call center to submit a claim.
In this journey map, the member experienced negative emotions for receiving a claim denial, the member phoning the call center, and the agent reprocessing the claim for the member to be reimbursed for covered expenses.
JOURNEY MAP FOR MEMBER SUBMITTED CLAIMS OPPORTUNITIES TO BE FIXED
How to use the Journey Map Steps:
- Identify customer interaction to be mapped based on FCR insights
- Determine the steps and sequence of steps in a customer interaction
- For each step, identify questions, tasks, decisions, activities required, and for the company (behind the scenes activities that directly impact the customer's journey)
- How did the customer rate the emotional experience of each step? 0 is neutral, plus 5 is extremely positive, and minus 5 is extremely negative. After each moment is rated, plot the steps along the timeline using the emotional scale
- Draw a line connecting each point in the sequence
- Identify which moments offer the most significant opportunity for redesign. Focus on the moments with the lowest emotional experience rating and the moments with the greatest opportunity to lift the line.
Tips. You can use this process to map one customer, multiple customers, or customer personas. You can use the journey map process for all touchpoints and interactions or just focus on critical moments of truth.
Journey Mapping Results
After completing the above journey map steps, we improved the member journey experience. The member impact goal was to eliminate claims returned for missing information and educate members before submitting a claim on what is needed.
As a result of FCR measurement as a validation, they improved the member-submitted claims call type by 4%, from 73% FCR to 77% FCR. Furthermore, we were also able to reduce the number of returned claims for a quality issue due to missing information from member-submitted claims by over 30%.
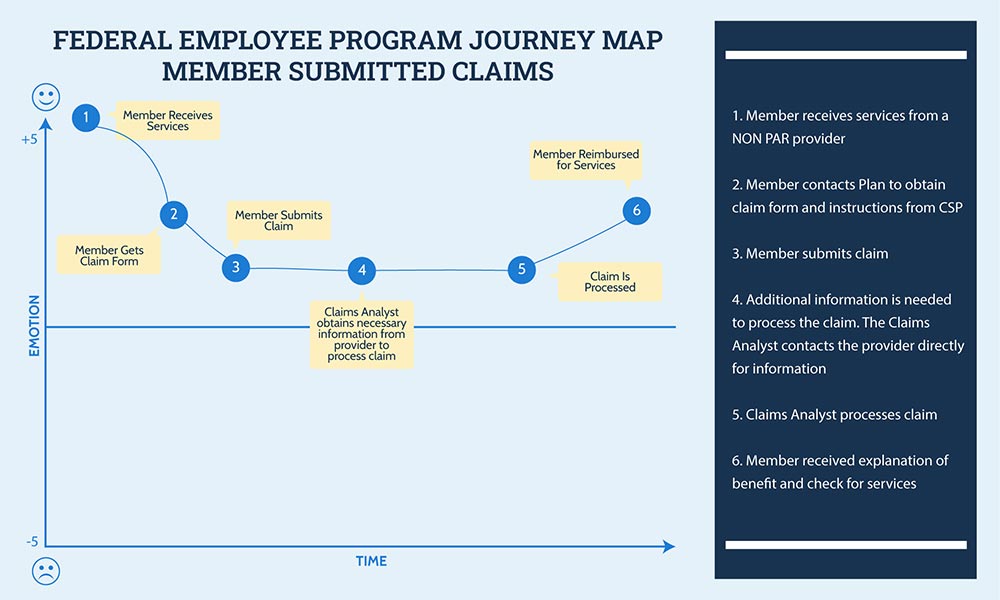
The below journey map illustrates the member experience after we fixed the problem with members submitting a claim for a nonparticipating provider, and then the claim is returned for missing information. In addition, we conducted a post changes journey map to assess member emotions with members submitting a claim to verify that our changes had a positive CX impact. The journey mapping results showed only positive emotions (e.g., happy face) for all the steps associated with submitting a claim.
JOURNEY MAP FOR MEMBER SUBMITTED CLAIMS OPPORTUNITIES AFTER FIXES ARE MADE
Journey Mapping Progress and Insights
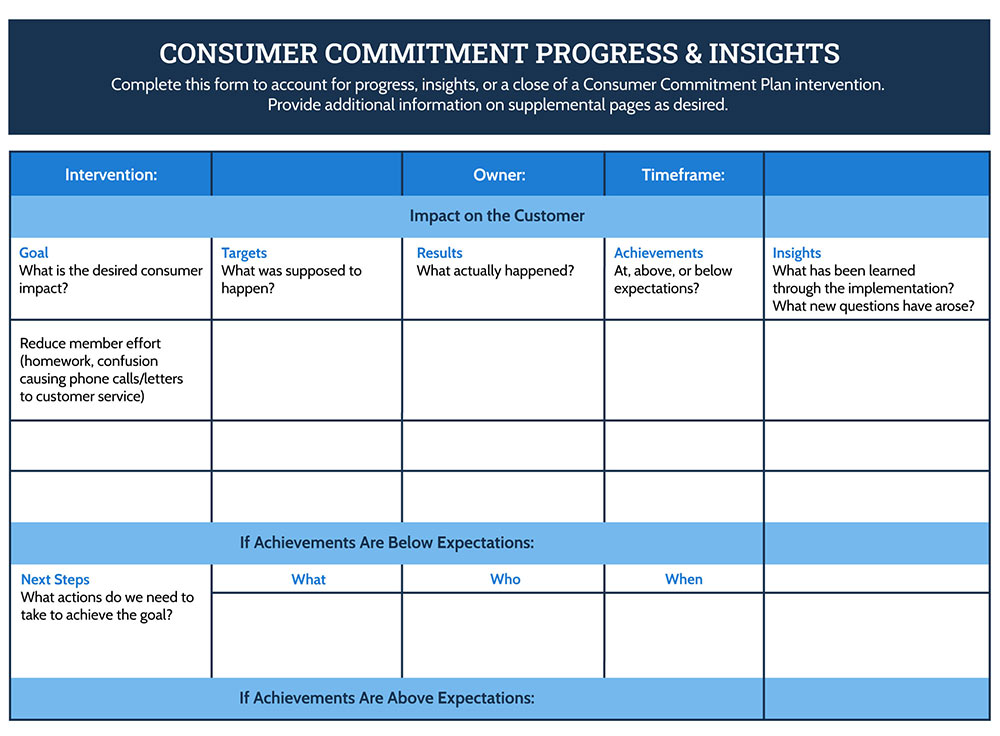
To assist us in our member journey mapping initiatives, we have the workgroup assigned to the project complete a commitment progress and insights form, which is shared with management. We use this form to ensure we have effectively managed our journey mapping initiative. Furthermore, the form identifies the owner and the timeframe for the journey mapping initiative.
For example, the journey mapping form includes goals (e.g., What is the desired member impact?), targets (e.g., What was supposed to happen?), results (e.g., What actually happened?), achievements (e.g., At above or below expectations?), and insights (e.g., What has been learned?). If achievements are below expectations, a plan is developed to describe what actions we need to take to achieve our goals.
A best practice for journey mapping initiatives goals includes FCR and Csat metrics. Including FCR and Csat metrics allows us to understand the member CX performance prior to the interaction journey map improvement. In addition, after we made changes to the member journey map experience, it is essential to measure if we improved the CX by using the FCR and Csat metrics.
What has helped us successfully use journey mapping initiatives to improve CX is incorporating the FCR metric into the mapping process to understand what to improve and determine after we made changes if we improved CX. In addition, we keep the maps very simple, focusing on critical moments of truth that have the most significant impact on the member experience. Put simply, we ensure that our maps are easy to understand so that the workgroups that need to implement the changes can focus on making the changes that drive improvement instead of worrying about a complicated journey mapping process.
SQM Awards Received
Customer Journey Mapping Best Practice (Federal Employee Program): 2021
Call Center World Class FCR Certification (Federal Employee Program): 2021
Call Center World Class FCR Certification (Federal Employee Program): 2020